Do Trading Indicators Actually Predict Price?
· #technical-indicators #quantitative-research #systematic-trading #volatility #backtesting
No. On 849,963 one minute bars of gold, every classic indicator I tested lined up best with price at a lag of zero, meaning it described the move I could already see rather than the one coming next. They are transformations of price that has already happened. That does not make them useless, but it does mean they cannot be the reason a trade starts.
As a self taught quant trader I believed the opposite for years, which is the only reason I finally went and measured it. What follows is the audit, the results that embarrassed me, and the specific design change that came out of it.

What happens when you measure whether an indicator leads price?
You find out it does not, and the answer is not close.
I took XAUUSD on the one minute chart, 849,963 bars from January 2024 to May 2026, built out of roughly 162 million real ticks, and asked one boring question of each indicator. At what delay does a change in this indicator line up best with an actual move in price? If it leads, the best match sits in the future. If it lags, the best match sits in the past.
Every one of them came back at zero. Moving average distance, RSI, the DI spread out of DMI, all coincident. RSI on the standard length matched the current volatility normalised price impulse at 0.962 correlation, which is a polite way of saying RSI was showing me the candle I was already looking at.
The only features that genuinely lagged were the derived ones. The slope and the acceleration of RSI both peaked at three bars behind price, and their predictive content had a half life of one to two bars. The level readings held their small signal for seven to twelve bars. None of that is a scandal. It is what these tools are. The scandal is that I spent years treating a transformation of the present as information about the future.
Why does confluence between indicators feel more convincing than it is?
Because a lot of what looks like independent agreement is one number printed several times.
While auditing the feature set I ran a correlation matrix over everything I was feeding the research engine. RSI on the standard length and the DI spread out of DMI came back correlated at 0.935. Those two live in different corners of the platform, written by different people, decades apart. One is a bounded oscillator and the other is a directional movement construct, and on my data they carried nearly the same information.
It got worse before it got better:
- RSI at three different lengths correlated with itself between 0.935 and 0.978.
- Adjacent moving average distances sat at 0.93 to 0.94.
- The distance to a long moving average and the slope of that same average correlated at 0.994, so the slope added essentially nothing over the distance.
- The positive and negative DI lines were so close to their own difference that keeping all three was arithmetic rather than analysis.
I had not built a dashboard. I had built one number, printed six times, in six colours, and I had been reading agreement between the copies as confirmation. Confluence between two redundant indicators is not confluence. It is the same opinion repeated, and it feels far more convincing than a single reading precisely because it arrives twice.
Why is ADX the one indicator I kept?
Because it is the only one that admits it has no opinion about direction, which turns out to be the useful property.
In the same audit, ADX correlated with the signed price impulse at 0.001. It genuinely does not know which way price is going, and it does not claim to. Against the absolute size of the DI spread it sat at 0.593, high enough to be related, low enough that it was not a duplicate of anything else on the sheet. In a feature set where almost everything was a copy of something else, ADX was the one reading that was actually orthogonal.
I tested it for directional edge anyway, and it produced nothing. Worse than nothing. Its conditional signal came out at a t statistic of minus 0.18, and the sign of its contribution flipped from one validation fold to the next, agreeing with itself in exactly half of the six folds. That is a coin.
So it does not get a vote on direction. It gets a different job. It describes the state of the market, trending or not trending, and a state description is allowed to refuse a trade that something else proposed. It is never allowed to propose one.
Do classic indicators add anything out of sample?
No. Measured properly, every family I tested came back flat to negative.
The setup is what makes this test fair, so it is worth being precise about it. I built a baseline of things I already knew: recent price momentum, current volatility and the slope of that volatility, and where price sits relative to the volume profile structure. Deliberately no moving average, no RSI, no DMI and no ADX in that baseline, by construction.
Then I asked, one family at a time, a single question in a nested walk forward. Does adding this family to what I already know improve the forecast on data the model has never seen? Not is it correlated with returns. Not does it look right on the chart. Does it add anything on top of the baseline, out of sample.
| Family added to the baseline | Incremental out of sample R squared |
|---|---|
| Moving average distance | minus 0.00006 |
| RSI | minus 0.00008 |
| ADX | minus 0.00005 |
| DMI | plus 0.00004 |
| All four together | minus 0.00023 |
The one positive number is indistinguishable from nothing, and the signs held when I re ran the whole thing on a longer forecast horizon. Adding these families made the out of sample forecast slightly worse than not having them, because they contributed noise and no information the baseline lacked.
The uncomfortable part is the contrast. Inside the sample every one of them looked statistically respectable, with stable conditional signals at t statistics around 6 to 8 that would pass most people's bar. Out of sample they gave back less than nothing. That gap is the whole subject, and with 849,963 bars the in sample significance follows almost automatically from the sample size rather than being earned by the signal.
So why do I still ship them?
Because the audit did not say these tools are worthless. It said something narrower and much more useful, which is that none of them earned the right to be the sole reason a trade exists.
Those are different sentences, and the difference is the entire design. In my system, classic indicators are a veto, never a trigger.
Nothing enters because a moving average crossed or an oscillator turned. The decision starts at the volume structure and the flow around it, which is a different kind of information: not a transformation of price, but a record of where business actually got done. A trend quality check can then refuse a trade whose backdrop disagrees. A momentum veto exists and ships switched off.
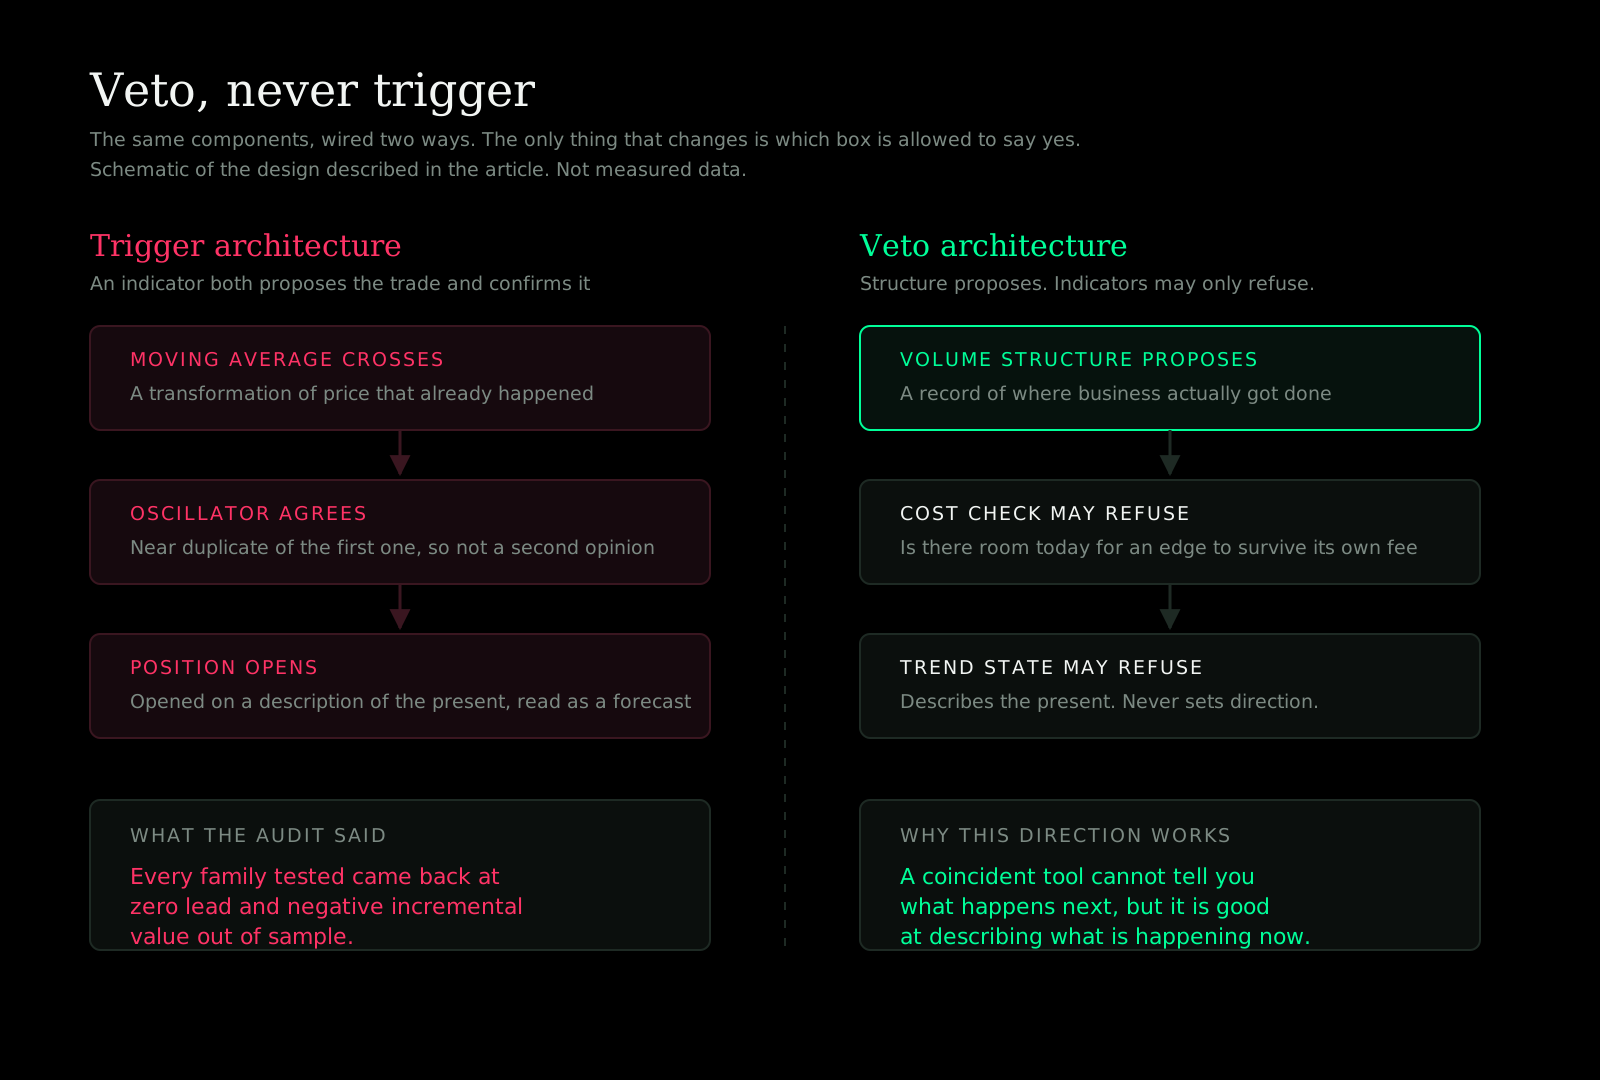
There is an honest reason it works in that direction. A tool that is coincident with price cannot tell you what is about to happen, but it is perfectly good at telling you what is happening right now. Refusing is a present tense job. Predicting is not. I did not need better indicators. I needed to stop giving the ones I had a job they were never capable of doing.
Why did I stop measuring the market in price and start measuring it in ATR?
Because a 40 pip move on gold at three in the morning and a 40 pip move a minute after a US session release are not the same event. Same number, two different markets.
For a long time my rules were written in price. A stop this many pips away. A buffer this wide. A filter that triggers past this level. Every one of those rules was quietly assuming the market has one speed, and gold does not have one speed.
So I rewrote the measurements. Nearly every condition my system reads is now expressed relative to the market's own recent volatility rather than in absolute price. Not is this move big, but is this move big for right now.
This is what I mean by adaptive, and I want to be specific because the word gets used for almost anything. I do not mean the system learns online, or re optimises itself, or changes its mind about strategy. I mean its measuring stick rescales. A frozen configuration is the only kind whose backtest means anything, and normalising every read against current volatility is what makes a frozen configuration survivable.
I should also say where that work is incomplete. A handful of absolute pip floors are still in the current configuration, including a minimum stop distance, a node band and an anti churn guard. Converting them to volatility units is scheduled work rather than finished work, and it matters most for cross symbol correctness, because a gold pip and a Bitcoin pip are not comparable quantities.
What does the gap between two moving averages actually tell you?
Nothing, until you divide it by volatility. Then it starts telling you something portable.
The usual multi timeframe approach checks whether a fast average sits above a slow one, and whether the higher timeframe agrees. That is a yes or no question about something that is obviously a matter of degree. Two averages can be ordered correctly and sitting almost on top of each other, which is a market that has decided nothing. Two averages can be ordered correctly and separated by a wide, clean gap, which is a market with a direction. A crossover check calls both of those aligned, and they are not the same market at all.
So measure the separation in units of current volatility instead of in price. How far apart are they, relative to how far this market normally travels right now?
That one change makes the reading portable. The same threshold means the same thing on a quiet day and a fast one, and on instruments with completely different tick sizes. It also kills most of the false alignment, because in a chopping market the averages tangle and the normalised gap collapses, exactly when a crossover check would be flickering between yes and no. In my system that reading is a veto, consistent with everything above. It can refuse. It never starts anything. You can test the idea tonight on any chart without buying anything.
Why is a stop in pips a different stop every hour of the day?
Because a fixed distance is not a fixed risk. It is a fixed distance, and the market decides what that distance is worth.
In a quiet hour a pip based stop sits far out in space and almost never gets touched, so losers run longer than intended. In a fast hour the same stop is inside the ordinary noise of the session, and it removes you from positions that were fine. One number on the ticket, two completely different decisions, chosen for you by the clock.
Once stops and sizing are expressed in volatility units, the meaning stops drifting. Risk becomes a percentage of the account and the lot is derived from the volatility based stop distance, so the same risk setting produces a smaller lot when the market is moving faster. That change also needs its own safety rail. A rollover spread spike once compressed the stop distance enough to briefly size a lot around twelve times normal. That was diagnosed, fixed with a floor that sizes as though the stop were at least a set fraction of ATR, and confirmed on MetaTrader 5. Volatility scaling is a better default, not a free one.
I am not going to publish my distances, and you should be suspicious of anyone who hands you theirs, because a distance lifted out of the system around it is just a number that worked once. The transferable part is the unit, not the value. When I switched from pips to volatility units the biggest change was not any single performance statistic. It was that the system stopped behaving like a different strategy depending on what time I turned it on.
What decides whether a trade is allowed to exist at all?
An affordability check that runs before any question about whether the setup looks good.
The logic is simple arithmetic. Every trade pays the spread. What a trade can realistically earn is bounded by how far this market is currently moving. The ratio between those two tells me whether there is enough room in this market, today, for an edge to survive its own costs. When the ratio is bad the system stands aside for the day. No prediction involved, no indicator consulted. It is the same reasoning as declining a job that pays less than the commute.
I will not publish where the line sits, because a threshold constant lifted out of a system is worth nothing to you and gives away something real. What it did is the part worth knowing. Over the validated window from 2024 to 2026 the guard blocked roughly one day in three, 235 of 736 days, and the blocks were not spread evenly to look busy. Only 50 of the 367 days in the calmer 2025 to 2026 stretch were blocked. The rest landed on the year the system found hardest.
That year is the reason the check exists. In 2024 the median spread ran at about 8.6 percent of daily volatility against a normal 3 to 4 percent, and on real MetaTrader 5 fills the strategy took a 74.2 percent peak to trough drawdown. Most scalping edges I have tested did not die from bad entries. They died from being measured without their entry fee, and then traded on days when the fee was larger than the edge.
What did that guard cost, and why is it still off by default?
It cost about 14 percent of the good era's growth, and it failed one of its own five pre registered criteria, so I do not call it validated.
This is the part I would want to read if someone else had written this article. The pre registration was written before the reproduction ran, and it set five bars the guard had to clear. It cleared four. It failed the collateral damage test, blocking more benign days than the criterion allowed and clipping roughly 14 percent of the calm period's growth, partly through a lag getting out of the 2024 regime and partly through a few 2025 volatility clusters it sat out.
A separate broker level test measured the other side of the trade. Running the guard on over the strongest twelve month window skipped exactly 68 entries on exactly 13 predicted days, and cost about 7.2 percent of the final result. So both sides are now measured: a real premium in calm years, a large reduction in drawdown in a hostile one.
Because the threshold is specific to the spread habitat of one broker's feed, the guard ships off by default and the tracker stays on as telemetry. Copying that threshold onto a wider feed would silently mute the strategy. This is also how the session gates were settled, by falsification rather than preference: removing them and trading around the clock was rejected, because every un gated hour made profit factor and drawdown monotonically worse.
It took me quite a while to build my own DQuants framework so this loop runs quickly, from hypothesis validation all the way to deployment. The speed matters less than the fact that a rejected result like this one leaves a record I cannot quietly edit later.
Frequently asked questions
Do trading indicators predict future price movement? On the data I measured, no. Across 849,963 one minute bars of gold, RSI, moving average distance and the DI spread all correlated best with price at a lag of zero, meaning they describe the current move rather than the next one. The only features that showed a real lag were derived ones such as RSI slope, which peaked three bars behind price. An indicator is a transformation of price that has already happened, and that is a statement about what the category is, not a criticism of any particular tool.
Is confluence between indicators real confirmation? Often not, because many indicators are near duplicates of each other. On my data RSI at the standard length and the DI spread out of DMI correlated at 0.935 despite coming from different families, and RSI compared against itself at three lengths ran between 0.935 and 0.978. When two redundant readings agree, that is one opinion arriving twice, and it feels more convincing than a single reading for exactly the wrong reason.
Why keep ADX if it cannot tell you direction? Because not knowing direction is what makes it useful as a state description. ADX correlated with the signed price impulse at 0.001 and with the absolute DI spread at 0.593, so it was the one genuinely orthogonal reading in a feature set full of copies. It tells me what kind of day this is, and a description of the day is allowed to refuse a trade even though it is never allowed to propose one.
What does "indicators are a veto, never a trigger" mean in practice? It means no position may open because an indicator did something. The proposal comes from the volume structure and the flow around it, which is a record of where business actually got done rather than another transformation of price. Once something real has proposed a trade, a trend quality check is permitted to refuse it. Brake, never accelerator, and most retail stacks including my own for years had it precisely the other way round.
What does "adaptive" mean here? Only that the measuring stick rescales. Nearly every condition is expressed relative to the market's own recent volatility instead of in absolute price, so one frozen configuration keeps meaning the same thing in a quiet Asian hour and a violent minute after a release. It does not mean the system learns online, re optimises itself between trades, or changes strategy. Continuous self tuning was considered and rejected, because at roughly a thousand trades a year there is nowhere near enough data to justify it.
Why measure stop distance in volatility instead of pips? Because a fixed pip distance is a fixed distance rather than a fixed risk, and the market decides what that distance is worth hour by hour. The same stop is far out of reach in a quiet session and inside ordinary noise in a fast one. The unit travels between systems and symbols. The value does not, which is why I will not publish mine and would not use anyone else's.
Are these live trading results? No. Every figure here is research output: an indicator audit on real tick derived bars, and backtest or validation runs on real broker tick data. I run a live test and monitor it, and I will publish what it shows, but quoting research output as performance would be dishonest. My cost model charges spread while slippage, latency and swap are not yet modelled, so I treat live as thinner than the test rather than richer.
Has any of this failed? Yes, and the failures are the reason the design looks like it does. The cost guard failed one of its five pre registered criteria and is therefore not called validated. Trading around the clock without session gates was rejected on measurement. In 2024 the strategy took a 74.2 percent peak to trough drawdown on real fills in a high cost regime, which is disclosed rather than hidden, because a result you cannot fail honestly is not a result.
Which KenKem product does what? The Master Volume Profiler indicator runs on TradingView and on MetaTrader 5, and it shows the read while leaving the order with you. Master Volume Sniper on the MQL5 market is the Expert Advisor side, and it executes only the rules and risk settings a user configures for themselves. Neither is a signal service, and neither removes the need to think.
Written by KenKem, a software engineer and founder of twenty years, learning quantitative trading in the open and publishing the process, rejections included.
This article was composed from the engine internals posts of the KenKem build log series. Educational purpose only. Not financial advice. Figures cited are audit, backtest and validation results on real tick data, not a live track record. Past performance does not guarantee future results.