When Is a Trading Strategy Ready to Go Live?
· #systematic-trading #walk-forward #backtesting #research-method #risk-management
When it has cleared a set of checks I wrote down before I ran them. In my own work that means a pass bar fixed in advance, results on data the system never trained on, costs charged on every simulated trade, agreement between the tested logic and the deployed one, and a written list of what would make me shut it off.
None of that is a result. It is permission to find out. As a self taught quant trader the single most useful habit I have built is the distinction between those two things, because almost every expensive mistake I made started with treating a backtest as a paycheck instead of a permission slip.
What is a deploy gate?
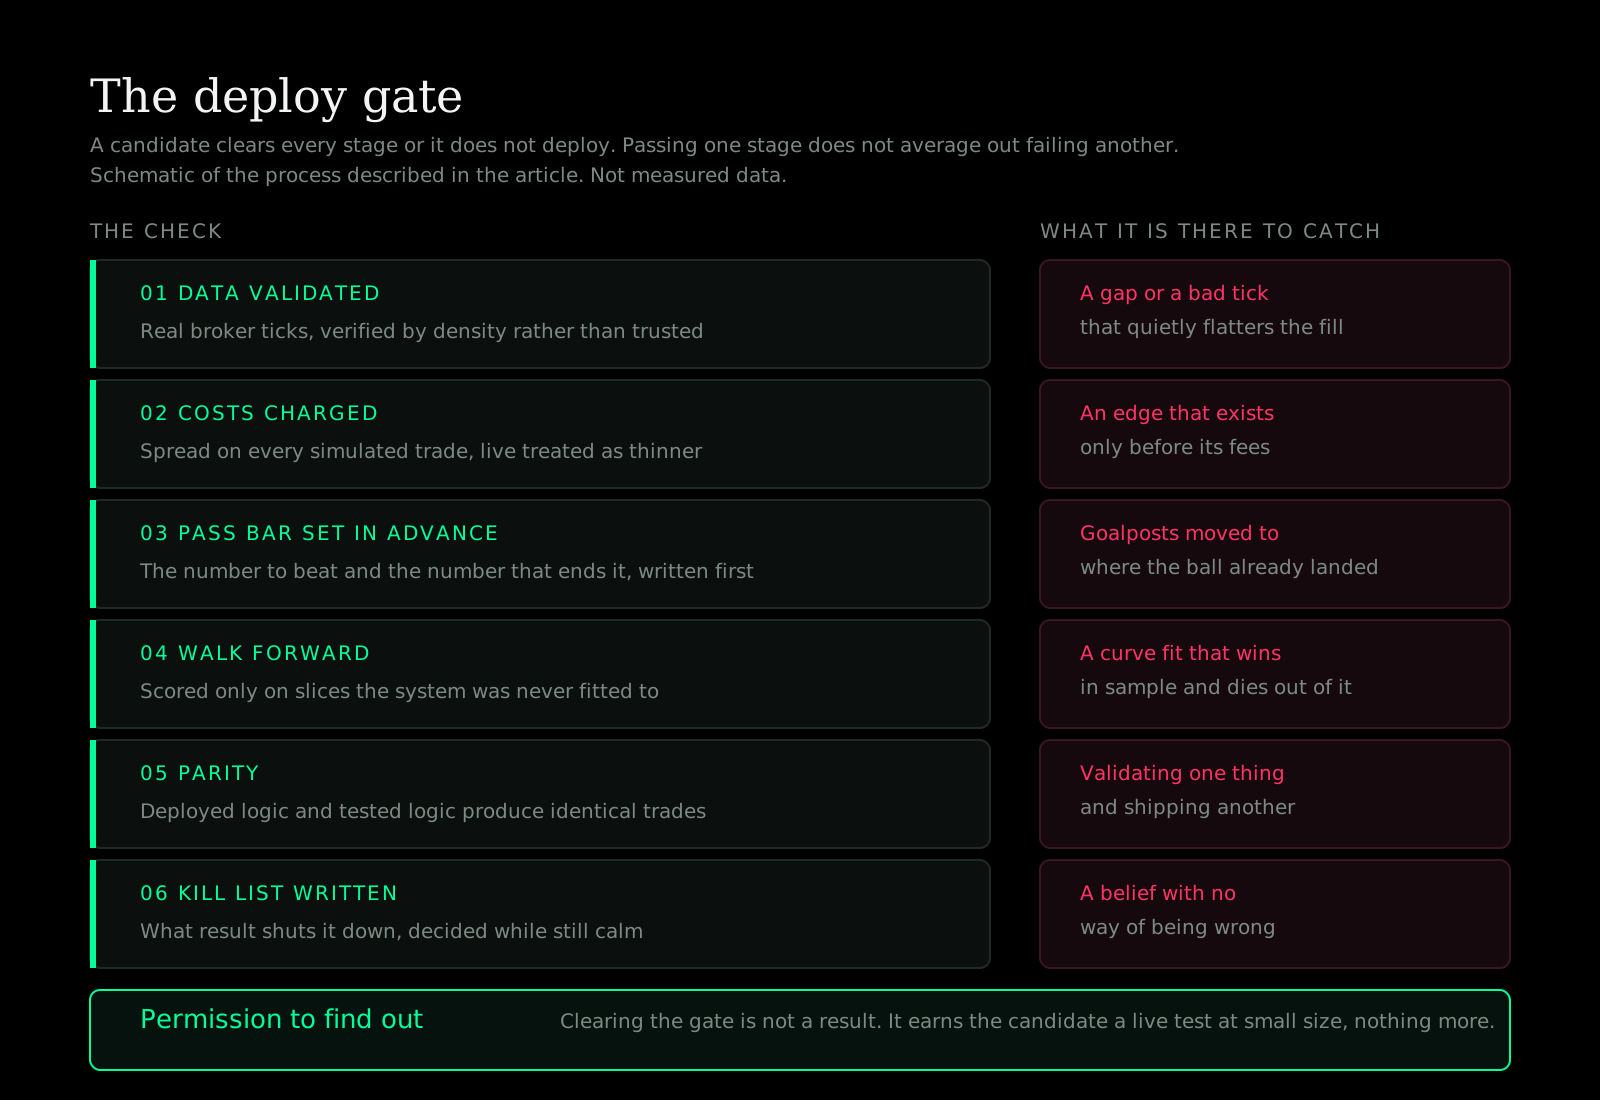
It is a fixed set of checks that stands between a nice idea and real money, and a candidate does not go live until it clears all of them.
Mine is deliberately boring. Data validation. Cost modelling. A pre-registered pass bar. Walk-forward on unseen slices. Parity between the tested logic and the shipped one. A written kill list. Nothing on that list is exciting, and that is the point: the flashy part of trading is easy to fake, and the boring part is almost impossible to fake for long.
The gate is not bureaucracy. It is the only thing standing between my enthusiasm and my capital. Right now several of my candidates have not cleared it, so they are not deployed. Not deployed yet is a feature, not a delay.
Why write the pass bar before running the test?
Because a bar set afterwards is not a bar, it is a description of wherever the ball already landed.
I define the number to beat before the run, along with what result would make me abandon the idea. That small discipline is most of the difference between research and self-deception. If you cannot say in advance what would change your mind, the test is not really a test.
The same logic applies to the search itself. Every configuration I try makes it more likely that one of them looks good by chance alone, so the count has to be recorded and paid for. In the MasterVP gold work the search context was 36 configurations, and the overfitting statistics were fed that number rather than a flattering subset of it. Deflating a result by your true search breadth is uncomfortable and it is also the only honest way to read it.
What does walk-forward actually prove?
That the system can do something on data it has never seen, which is the closest thing I have to honesty about the future.
Walk-forward builds on one slice of history, tests on the next slice the system was never fitted to, then rolls forward and repeats. It throws away the comfortable habit of fitting the whole past at once, and it is harsh in a useful way. In the DQuants engine I developed, walk-forward is the default way a candidate gets scored, and the summary only reports the slices it never trained on.
Here is what that looked like on the gold strategy I have taken furthest, all of it backtest on real broker ticks rather than a live record. On a calendar-month walk-forward, 11 of 12 months came out positive. The twelfth did not: August 2025 finished with a profit factor below one and a 21.6% loss. On an equal-sized fold split, 7 of 8 folds were positive and the worst fold also finished below one. Those two losing slices are the part of the result I trust most, because a curve fit does not usually leave them lying around.
One more comparison from the same runs, because it surprised me. The frozen configuration held up across more folds than per-fold re-optimisation did. Re-optimising on every fold sounds more adaptive and mostly bought me a better fit to noise.
What happens when the measuring tool is wrong?
Every ranking it produced becomes suspect, including the ones you liked.
I once demoted a strategy variant because my engine said another version was better. That engine had an exit-accounting defect that structurally favoured the version with larger trailing runners, so the comparison was rigged by my own tool and I did not know it. The verdict did not survive the fix. I am re-running that head to head on the corrected engine, and the earlier conclusion does not count.
This is why parity sits inside the gate rather than next to it. Before anything goes live, the deployed expert and the tested logic have to produce the same trades on the same data. On the current gold build that check reproduced the reference run exactly, trade for trade. If the two disagree, then whatever I validated is not what is actually running, and the validation protects nothing.
Why prefer a robust result over a spectacular one?
Because the spectacular one is usually well fitted to a moment that is not coming back.
I would rather have a strategy that is merely okay across many conditions than one that is brilliant in exactly one. So candidates get graded across volatility regimes, not only the window they happened to be born in, and the equity path gets stress tested by resampling and reordering trades. On the gold strategy, 20,000 Monte Carlo iterations put the worst reordered drawdown at 54.8%. That number is not a forecast. It is a reminder of what the same edge can feel like in an unlucky order.
Robustness also means telling you where it broke. In 2024, on real MT5 fills, that strategy lost 67.1% with a 74.2% drawdown. Spread that year ran at roughly twice its normal share of volatility, and no sizing I would ship survives a 2024 type year. That is disclosed in my own research notes as the single most important correction in the work, and it is the reason I describe the edge as having a habitat rather than a guarantee.
What did change was the risk architecture. Adding a stand-aside rule for measurably expensive days and reducing position size while the account sits below its equity peak took the worst case drawdown on that hostile window from 56.7% to 22.2%. I will describe what those mechanisms do. I will not publish the thresholds that arm them, because a threshold is the part someone can misconfigure.
What would make me kill it?
For every candidate I keep a written list: a break of the drawdown ceiling, a profit factor that will not hold out of sample, a live curve that diverges from the tested one.
If you cannot say what would falsify your strategy, you do not have a strategy. You have a belief. My favourite candidate, the one with the cleanest origin story and the most plausible logic, is still on probation for exactly that reason. Liking a strategy is not evidence about a strategy, and my affection for an idea is precisely the bias the gate exists to neutralise.
There is also no rule that says I have to launch this quarter. The market will still be here. The cost of waiting is small and the cost of deploying something unproven is my credibility and someone else's capital, so the slow, unglamorous validation is what would make a later go-live mean anything at all.
Frequently asked questions
What is a deploy gate in systematic trading? A fixed sequence of checks a strategy must clear before it trades real money, defined in advance so it cannot be relaxed once you are attached to a result. Mine covers data validation, cost modelling, a pre-registered pass bar, walk-forward on unseen data, parity between the tested and deployed logic, and a written kill list. A candidate that fails any stage stays undeployed regardless of how well it did on the others.
Does passing a backtest mean a strategy is profitable? No. A backtest is a story about the past, and the market does not owe the future any resemblance to it. A clean backtest earns a strategy the right to be tested further, which is not the same as evidence that it will make money. I treat it as a permission slip rather than a paycheck.
How many trades does a backtest need before you can trust it? It depends on the return distribution rather than on a round number, and there is a statistic for it. The minimum track record length for my gold strategy came out at 192 trades, and the validation run covers 1,423 simulated trades on real ticks, roughly seven times the minimum. Those are backtest figures, not a live record.
What is walk-forward testing and why does it matter? You fit on one slice of history, test on the next slice the system has never seen, then roll the window forward and repeat. It matters because a curve fit wins in-sample and collapses out-of-sample, so testing only on data the model was tuned on cannot tell the two apart. The folds it loses are as informative as the folds it wins.
Should you re-optimise parameters on every walk-forward fold? It sounds more adaptive than it is. In my own gold runs the frozen configuration held up across more folds than per-fold re-optimisation did, which suggests the extra fitting mostly tracked noise. That is one strategy on one instrument, so treat it as a reason to test the question rather than as a general rule.
Why does engine parity matter before deployment? Because if the deployed program and the tested logic disagree, the thing you validated is not the thing that is running. The check is simple: feed both the identical data and require identical trades. On the current gold build that reproduced the reference run exactly. I have been bitten by that gap before, which is why it is a gate rather than a preference.
Do you publish the losses as well as the wins? Yes, and they are the more useful half. The gold strategy lost 67.1% in 2024 on real fills with a 74.2% drawdown, one walk-forward month finished below a profit factor of one with a 21.6% loss, and a long list of ideas were rejected outright, including a daily loss cutoff, a hard drawdown halt, lower profit targets, and an efficiency-ratio entry filter that showed no out-of-sample lift. The rejections are what make the survivors worth anything.
Is any of this a live track record? No. Every figure here comes from backtests and validation runs on real broker tick data, and my cost model charges spread on every trade while slippage, latency and swap are not yet modelled. So I treat live conditions as thinner than the test rather than richer, and I will not describe research output as performance.
Which KenKem product does what? The Master Volume Profiler is the indicator, on TradingView and on MetaTrader 5. It shows the read and leaves the order with you, and it is not a signal service. Master Volume Sniper on the MQL5 market is the Expert Advisor side, and it executes only the rules a user configures for themselves.
Written by KenKem, a software engineer and founder of twenty years, learning quantitative trading in the open and publishing the process, rejections included.
This article was composed from the deploy-gate posts of the KenKem build-log series. Educational purpose only. Not financial advice. Figures cited are backtest and validation results on real tick data, not a live track record. Past performance does not guarantee future results.