
Why Is a Real Trading Edge Smaller Than It Looks?
· #research-method #backtesting #risk-management #systematic-trading #trading-psychology
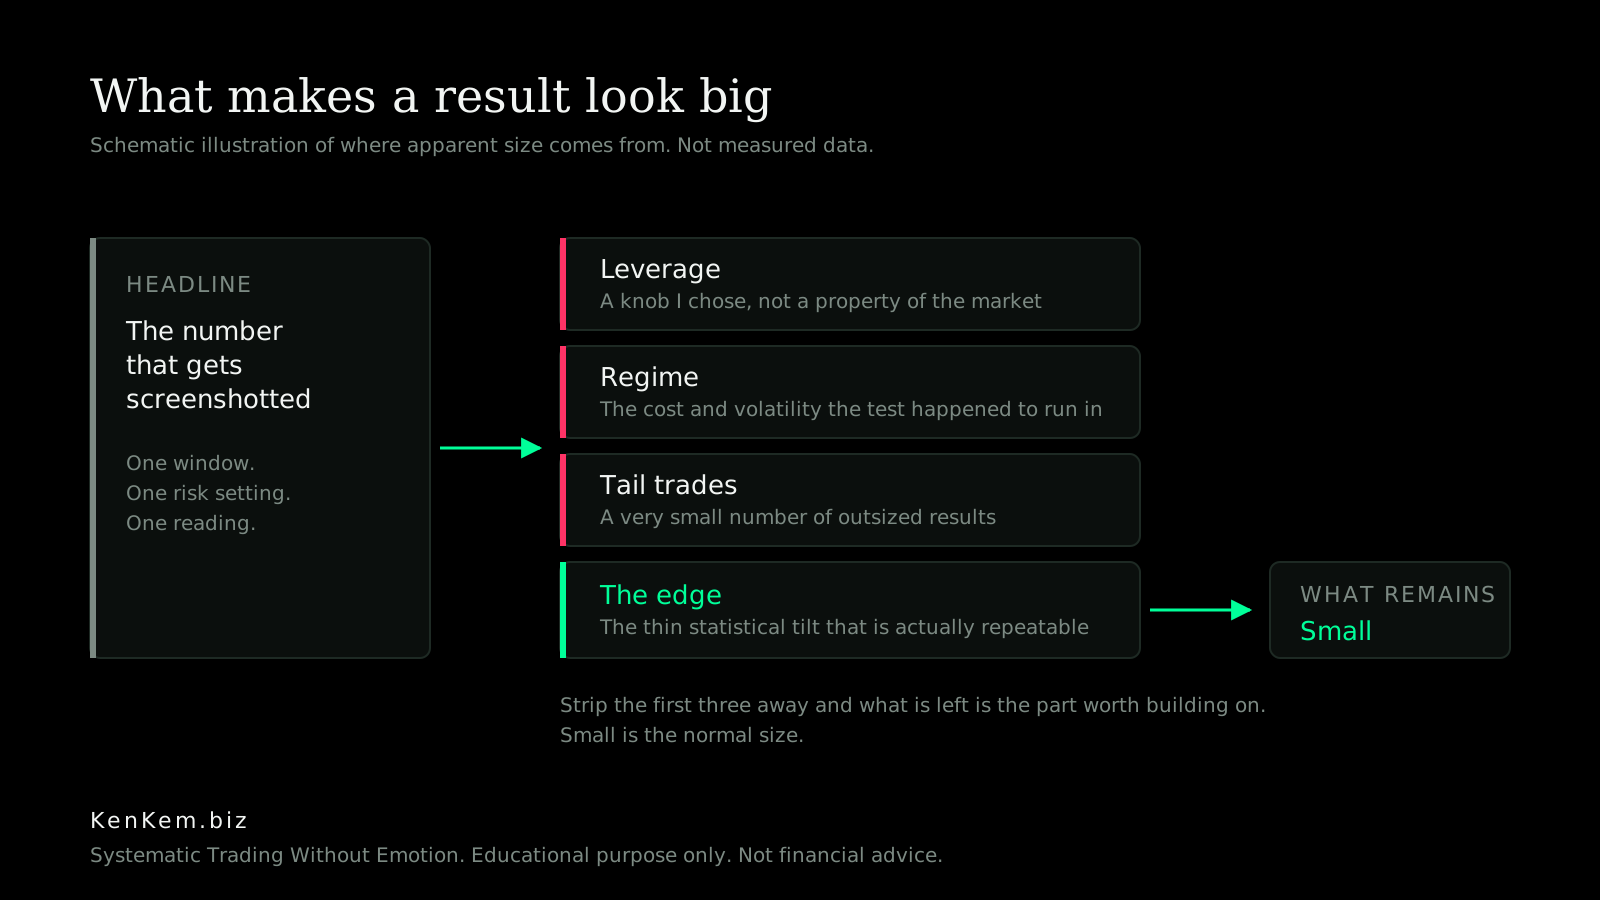
A real edge is small. Most of what makes a backtest look impressive is the risk setting, a favourable regime, and a handful of outsized trades, not the edge itself. The strategy research behind my gold work earns roughly 0.05 Sharpe per trade, and almost everything eye catching downstream of that number is a decision about position size rather than a discovery about markets.
That took me a while to accept, and accepting it changed how I build. What follows is the honest arithmetic of a small edge, including the parts of my own evidence that an outside reviewer took apart.
Why does an edge look bigger than it is?
Because a percentage return is a statement about leverage, and leverage is a knob rather than a finding.
Take a per trade Sharpe of about 0.05 and a risk percentage that can be set to almost anything, and the annual figure that comes out the other side is whatever the knob was turned to. Two systems with identical logic can report wildly different returns purely because one of them risks more per trade. Nothing about the market changed between them.
This is the single most common way a result gets oversold, and I have been guilty of it in my own documents. The fix is boring: separate the edge from the sizing whenever you report anything. The edge is the per trade statistic and the profit factor. The return is what happened when I chose how hard to press.
What does the size of my own edge actually look like?
Modest, and modest in a way that is easy to overlook if you only read the headline.
The certified configuration of Master Volume Profile on gold reports a profit factor around 1.42 on its validation window. In the breakout mode that carries roughly 96 percent of the entries, the average win is about the same size as the average loss. That single fact tells you where the edge is not: it is not coming from large winners riding for miles. It is a thin statistical tilt applied many times.
The walk forward picture is thinner still, which is the honest picture. Median profit factor across equal sized folds lands near 1.30, and in a Monte Carlo resampling with 20,000 iterations the fifth percentile profit factor is 1.108. Above one, so the edge survives being shaken. Nowhere near the numbers that get screenshotted.
I would rather build a machine around 1.1 that keeps showing up than around 3.0 that appeared once.
Why is one strong month not evidence of anything?
Because a month is a sample of about twenty trading days, and my edge needs far more than that before it means anything.
When I test durability I look at whether the behaviour repeats across windows rather than at whether one window was excellent. On calendar month walk forward, 11 of 12 months came out profitable with a median profit factor of 1.336. The interesting month is the twelfth. August 2025 finished at a profit factor of 0.69 and down 21.6 percent, inside the same window I would otherwise be tempted to call strong.
A losing month inside a positive year is not a defect to engineer away. It is the shape of the thing. Anyone who shows you a strategy without one has either got a very short window or is not showing you all of it.
How much of the result comes from a handful of trades?
Far more than I was comfortable with, and I only measured it properly after someone asked.
On a research stream of 3,502 gold trades, the top one percent of trades, 35 of them, account for more than the entire net result. Remove the best 30 trades, which is 0.86 percent of the sample, and the whole thing turns net negative. The return distribution has a skew of 3.49 and excess kurtosis of 19.5, and once you adjust for that, the Gaussian equivalent effective sample is around 326 rather than 3,502. My real margin over the minimum track record length is roughly 326 against 192, not the comfortable multiple I had been quoting.
The counter evidence deserves the same paragraph rather than a footnote. A 20,000 draw bootstrap of that same stream puts the probability of a non positive net result at 0.08 percent. The edge is robust to resampling itself. What resampling cannot speak to is whether the next two and a half years contain a comparable population of tail events, so the defensible statement is that the edge is real in the tested regime, carried by a small number of events, and its persistence is untested.
Profit factor and Sharpe are quoted as though they summarise a distribution. With kurtosis near 20 they do not.
What happened when I let an outsider check my numbers?
The number I leaned on hardest turned out to be incapable of failing.
I asked for a hostile external read of my process, not my equity curve. The finding that landed hardest concerned my most cited robustness statistic, the deflated Sharpe ratio, which adjusts a result for how many configurations were searched before it appeared. At my own recorded parameters the deflation threshold was so far below the strategy's own Sharpe that the search would have needed something on the order of ten to the fourteen trials before the verdict could have come out negative. It was reading a perfect score because the arithmetic could not produce anything else.
Worse, the test with genuine discriminating power had failed. The probability of backtest overfitting came in above one half in eight of nine cross validation cells, and I had overridden it with a narrative about where my configurations sat in the out of sample distribution. That override draws three samples from exactly the distribution the failed test had just declared unreliable.
None of that makes the edge fake. It means my evidence could not demonstrate that it was not, while my documents were written as though it could. So the saturated number no longer leads my evidence section, the discriminating one does, and the reporting rule I added is that a verdict from a gate that cannot fail prints as non binding rather than as a pass.
The uncomfortable part is that the reviewer used my own repository, my own code and my own recorded inputs. Everything he needed to find it had been sitting in front of me.
Why does a small edge make costs the whole game?
Because when the average win and the average loss are roughly the same size, cost is not a rounding error, it is the margin.
The clearest demonstration in my research is 2024. In that year the spread on gold ran at about 8.6 percent of average true range, roughly twice what the strategy was built in, and the same logic that looks solid elsewhere lost 67.1 percent with a maximum drawdown of 74.2 percent under MetaTrader 5 confirmation. Nothing about the rules changed. The cost of doing business changed, and a thin edge does not have the room to absorb that.
My own cost model still flatters me, and I would rather say so than have it found. Spread is charged on every trade in the engine I developed, Dquants, but slippage, latency and swap are not yet modelled. Live should be expected to be thinner than research, and the exit side of any number I produce deserves more suspicion than the entry side, because the engine cannot know the path price took inside a tick.
Does a smaller edge mean a worse business?
No, but it means a different one, and it means reporting honestly about scale.
The Sharpe ratio I quote for the flagship is about 3.8 inside its regime and about 1.8 across the full cycle, and I compute it the way a desk would rather than the way an in sample slice would hand it to me. There is a version of that number in the 8 to 10 range available if I choose a kind window and stop asking questions. I do not publish it, because it is a measurement of my window selection rather than of the strategy.
The other thing a small edge does is make diversification structurally valuable rather than a slogan. My second, more cautious gold configuration cleared its anti luck bar by four trades, 126 against a minimum of 122, which is a whisker rather than a wide margin, and I say so on the label. Its worth is not its own return. Its daily result is close to uncorrelated with the flagship, so in research the pair behaves more steadily than either alone. Two small honest edges that fail at different times can be a better business than one large fragile one.
There is still no live track record behind any of this. The only real money my flagship logic has traded is a small prop account with 62 trades, a sample far too thin to be meaningful in either direction. The honest headline is that live evidence is the thing I am missing, not the thing I am hiding.
How do I think about building on something this small?
I ask the questions I would ask about any production system, because that is what it is.
How does it fail. How do I test it. Is it maintainable. Which regime is this. Where is the invalidation. Those questions cut through noise faster than any amount of chart staring, mostly because none of them can be answered by how I feel about the idea. A strategy is software that spends money, and software that spends money deserves the same scrutiny as software that touches a database.
The standard I hold is not perfectionism, it is a refusal to let a weak idea spend my time or my risk budget on the strength of my own enthusiasm. Excitement is a signal about me. Evidence is a signal about the market. Only one of them gets the deciding vote, and if I could not reproduce a result on demand, I probably do not understand it well enough to rely on it.
What is the honest takeaway?
If you are arriving from engineering, expect the real thing to be smaller than the thing you imagined, and expect that to be fine.
A small edge is not a consolation prize. It is what a genuine statistical tilt looks like once you have removed the leverage, priced the costs honestly, counted the tails properly, and stopped grading your own homework with a test that cannot fail. Small is the normal size. The work is in making something that small survive contact with reality, and in reporting it accurately enough that someone else could check.
The number I trust most in my own research is not the biggest one. It is the one I tried hardest to break.
Frequently asked questions
How big should a realistic trading edge be? Smaller than most published examples suggest. In my own gold research the certified configuration reports a profit factor around 1.42 on its validation window, and the median across walk forward folds is closer to 1.30. A per trade Sharpe of roughly 0.05 is the underlying signal, and everything larger downstream of it is a position sizing decision rather than a stronger edge.
Why do backtest returns look so much larger than the edge? Because a return percentage combines the edge with the risk taken per trade, and only the first half is a discovery. The same logic can report very different annual numbers purely from the sizing knob. This is why I try to publish the per trade statistic and the profit factor alongside anything expressed as a percentage.
What is tail concentration and why does it matter? It is how much of a result comes from a very small number of trades. On a 3,502 trade research stream of mine, removing the best 30 trades, under one percent of the sample, turns the entire net result negative. That does not prove the edge is luck, a 20,000 draw bootstrap puts the probability of a non positive result at 0.08 percent, but it does mean profit factor alone is a poor summary of what happened.
Can a strategy with a 20,000 iteration Monte Carlo behind it still fail? Yes. Resampling tests whether a result is robust to reshuffling the sample it already has. It cannot tell you whether the next period will contain a similar population of events. My 2024 confirmation run is the example: same rules, a higher cost regime, and a 67.1 percent loss with a 74.2 percent maximum drawdown.
Why did you stop leading with your deflated Sharpe ratio? Because an external review showed it could not fail at my recorded parameters. The deflation threshold sat so far below the strategy's own Sharpe that no realistic number of search trials would have produced a negative verdict, so a perfect score carried no information. It now prints as non binding, and the test that actually discriminates, probability of backtest overfitting, leads instead. That test failed in eight of nine cells, and I report it rather than round it away.
Does a losing month mean the strategy is broken? Not on its own. In my calendar month walk forward, 11 of 12 months were profitable and the worst finished at a profit factor of 0.69 and down 21.6 percent, inside a window I would otherwise call strong. A run of results without a bad month usually means the window is too short rather than the system is unusually good.
How much do trading costs matter to a small edge? They can be the entire margin. When the average win is roughly the size of the average loss, spread and commission decide whether a thin positive becomes a thin negative. My own engine charges spread on every trade but does not yet model slippage, latency or swap, so I treat every research figure as optimistic relative to live.
Does Master Volume Profile have a live track record? No, and I will not imply otherwise. Everything above is backtest and MetaTrader 5 confirmation work on real historical tick data. The only live sample is 62 trades on a small prop account, which is not statistically meaningful, and live results should be expected to be thinner than research. Trading involves risk including the risk of loss.
Written by KenKem, a software engineer and founder of twenty years, learning quantitative trading in the open and publishing the process, rejections included.
This article was composed from the KenKem build-log series. Educational purpose only. Not financial advice. All figures cited are backtest, confirmation-run or audit results, not a live track record. Past performance does not guarantee future results.