Why Does a Trading Strategy Stop Working?
· #regime-awareness #systematic-trading #research-method #risk-management #trading-psychology
A trading strategy usually stops working because its conditions changed, not because its logic broke. Edge is conditional. It lives in particular sessions, volatility states and cost regimes, and the same code that earns in one of them bleeds in another. Most strategies never had those conditions written down, so nobody noticed the day they expired.
What follows is how I learned to treat conditions as part of the edge instead of as a filter bolted on afterwards, including the year my own configuration lost 67 percent doing nothing differently.
Why does edge depend on conditions rather than signals?
Because a signal is only a description of what happened, and conditions are what decide whether that description keeps being true.
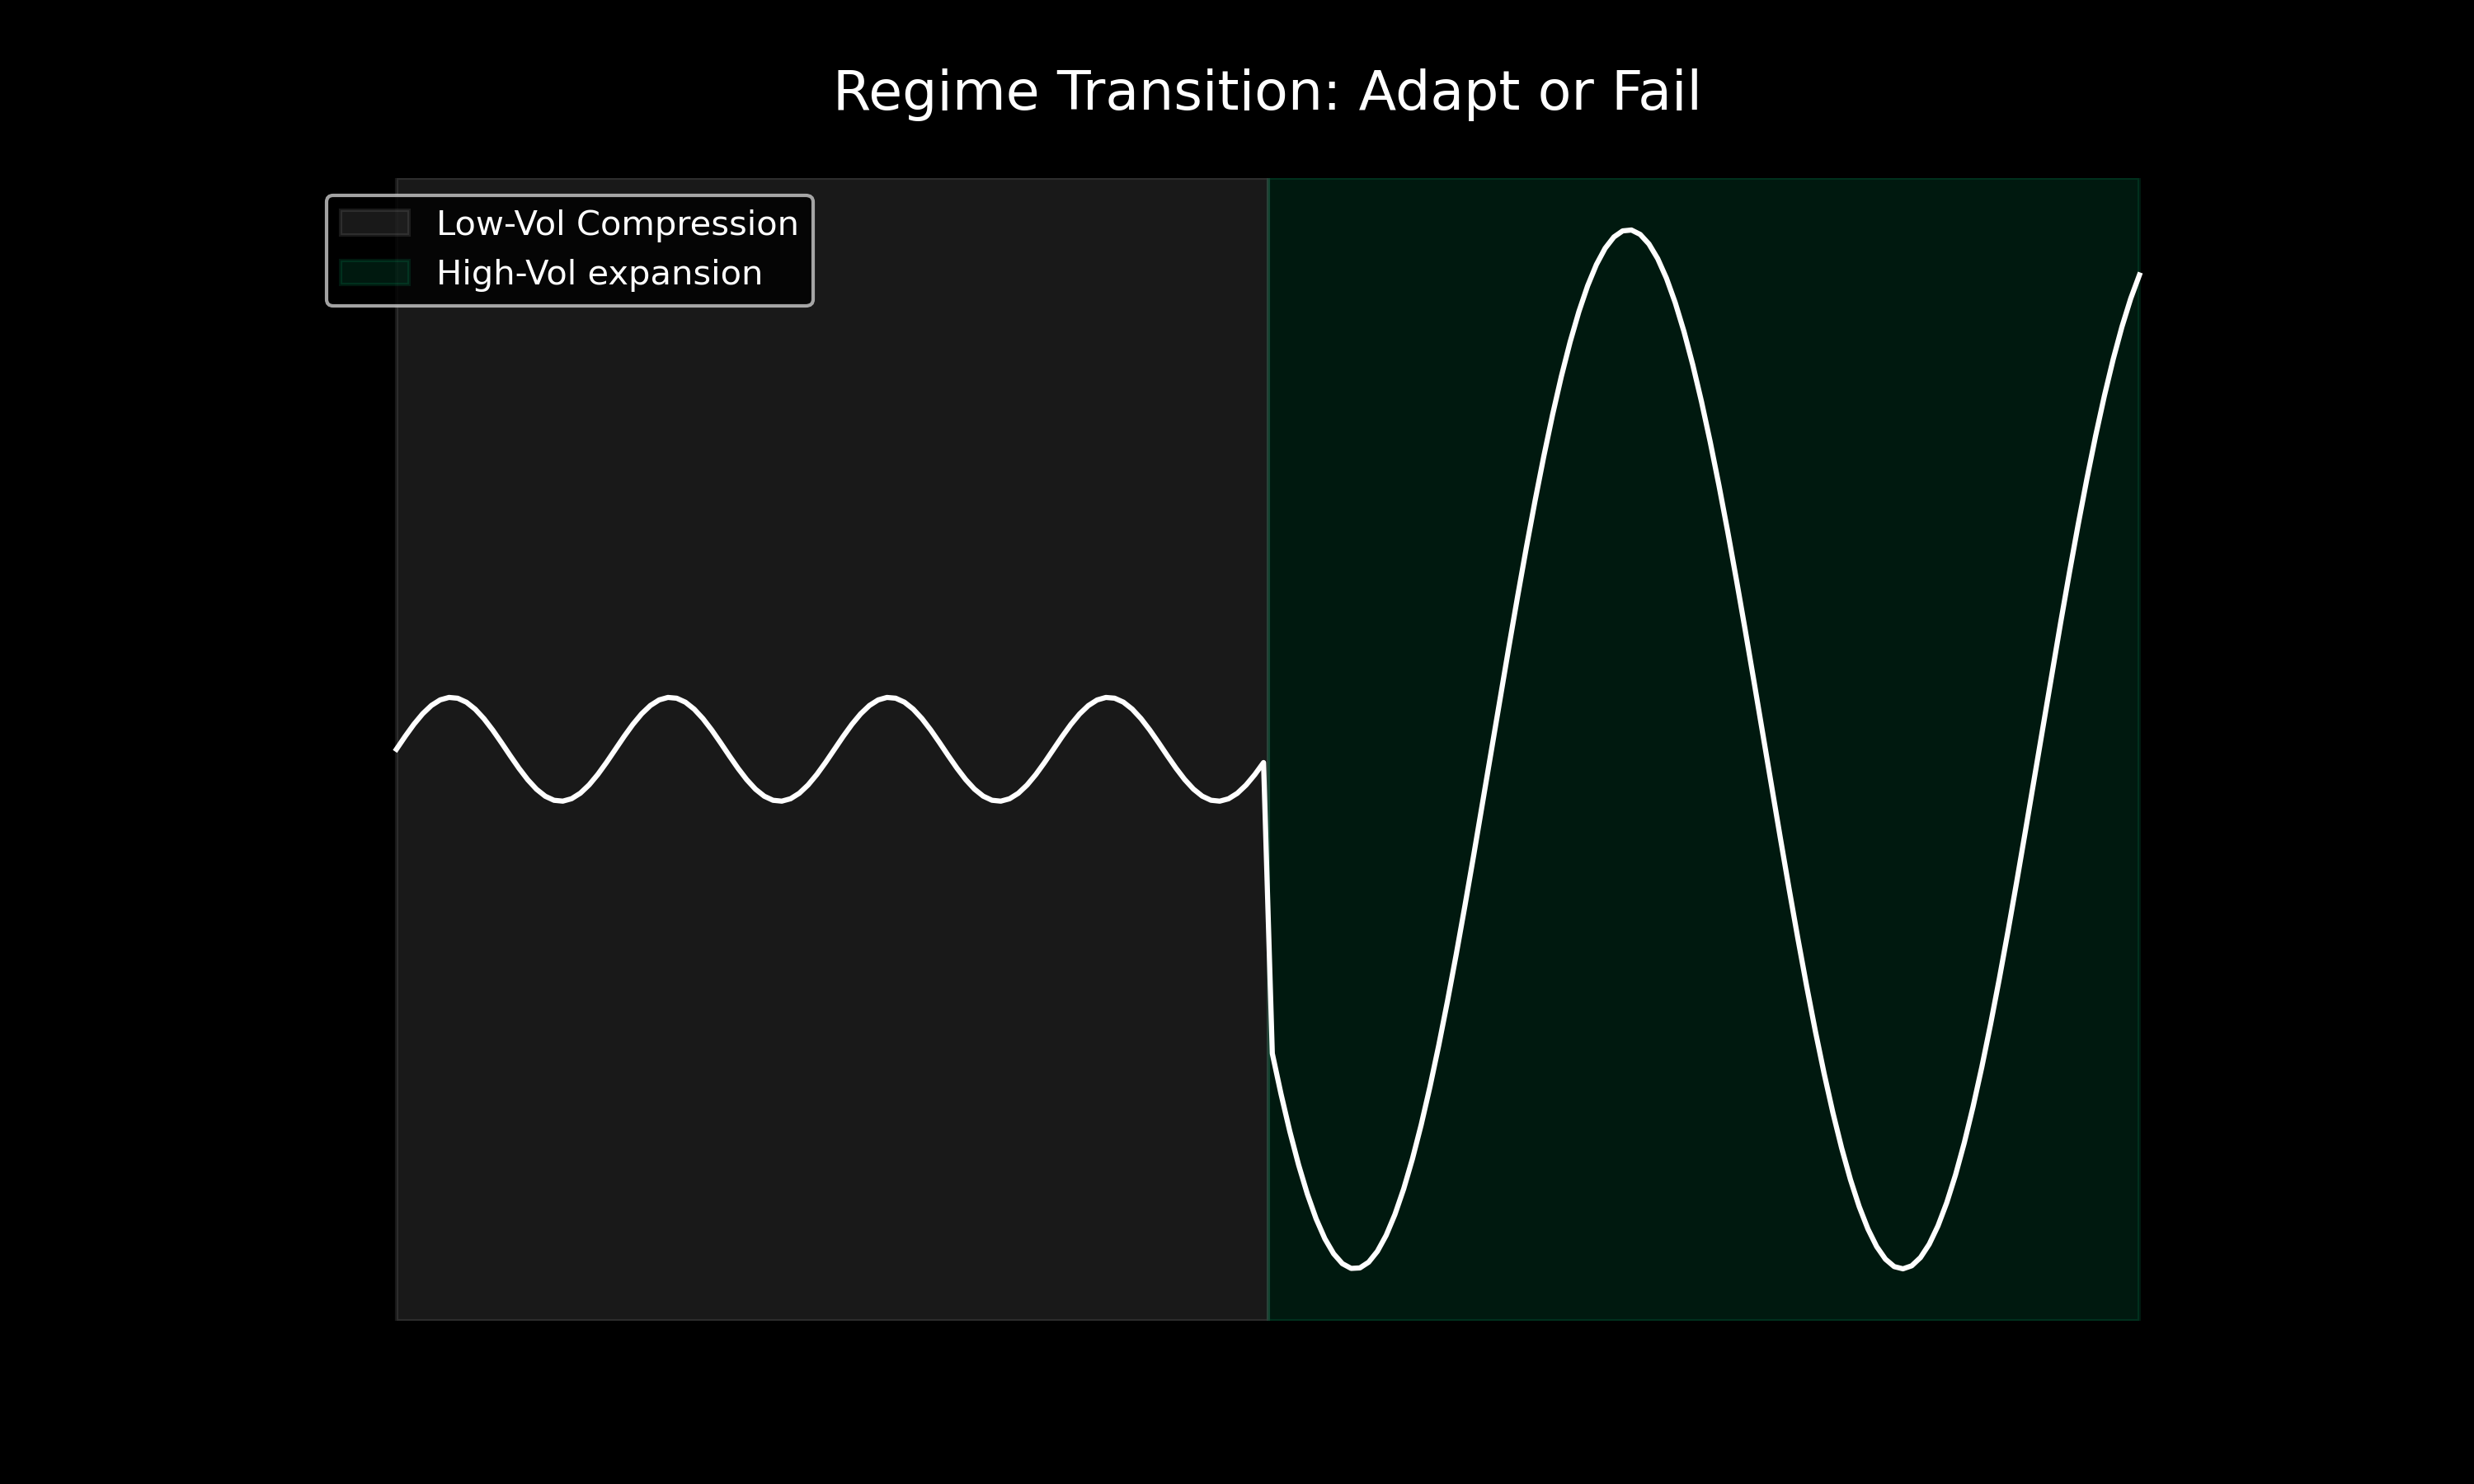
When I started, I looked for setups. Find the pattern, test the pattern, ship the pattern. The reframe that changed my research was realising the job is not only to find a signal, it is to find the conditions under which that signal deserves to exist. Trend and chop, compression and expansion, tight spread and wide spread are not cosmetic differences. They change the quality of the decision underneath an identical entry.
So in the Dquants engine I developed, every backtest is tagged by session and volatility state. A rule only ships if it holds in the regime it was built for. If you skip that tagging, you are not testing one idea. You are averaging one idea across several different markets and reading the mean as if it meant something.
What does it actually cost to ignore regime?
In my own research, sixty seven percent in a single year.
My gold configuration produced a 3.78 annualized Sharpe with a 19.7 percent maximum drawdown in the research engine, measured over the 2025 to 2026 window. Take that same fixed configuration, change nothing, and run it through 2024 on real MetaTrader 5 fills, and it returns minus 67.1 percent with a 74.2 percent maximum drawdown. In 2024 the spread ran around 8.6 percent of ATR, roughly twice normal, and the strategy simply paid the toll until there was nothing left.
Across the full 2024 to 2026 cycle the honest Sharpe is 1.77, not 3.78. Both numbers describe the same code. Only the habitat differs. My research notes carry the blunt version: no shipped sizing survives a 2024 type year. These are backtest and confirmation run figures from my own gold scorecard, not a live track record.
That result is why I stopped treating regime as a nice to have. The strategy did not degrade gracefully. It met a condition it was never built for and behaved exactly as badly as the arithmetic said it should.
Why is knowing when not to trade part of the edge?
Because standing aside is a decision with measurable expectancy, and in my testing it is a positive one.
The clearest evidence I have is a falsification. My gold configuration only takes entries inside explicit session windows and blocks specific low quality hours, and I wanted to know whether those gates were real or just inherited habit. So I dropped them and tested running around the clock. Every un-gated hour made profit factor and drawdown monotonically worse. Not on average, and not once. Every one of them. The gates are a measured edge lever, and I would not have known that without trying to remove them.
Two other stand-down mechanisms came from the same thinking. A minimum activity floor keeps the system out when the tape is too quiet to carry the edge. A cost tracker measures spread against prevailing volatility, so an expensive day can be recognised as an expensive day rather than felt as a run of bad luck. Both encode the 2024 lesson into a constraint instead of a memory.
Why can a strategy not simply adapt to its recent results?
Because recent results are the one input that reliably fails out of sample, and I have the rejected study to prove it.
I built a mechanism that sized the book to trailing realised edge, taking risk down after a weak stretch and up after a strong one. In sample it looked excellent, with better net results and roughly forty percent lower maximum drawdown. Walk-forward killed it. Choosing on the past produced negative out of sample results in nearly every fold, because losing streaks mean revert. Recent outcomes do not predict forward outcomes.
That study is also why an older piece of my own infrastructure stays switched off. A previous codebase contains an eight hundred line, win rate driven parameter nudger, and its trigger signal is exactly the signal walk-forward falsified. It is not deleted, it is disabled on the record. The same discipline killed reinforcement learning for entries: at roughly a thousand trades a year the sample is orders of magnitude short of what such a model needs, and its results could not be honestly deflated for the search that produced them.
The trap this closes is the trap of recent wins. A good week makes a strategy feel better than it is and makes me feel smarter than the data allows. Conditions have to be defined in advance, from causes, not fitted backwards from the last month of outcomes.
Why does defining conditions make trading feel calmer?
Because the argument happens once, at design time, instead of every few minutes with an open position.
This is the part that is hardest to explain to someone still trading by hand. Writing the conditions down does not feel like freedom, it feels like giving something up. In practice it moves the decision to the point where I am reliable and takes it away from the point where I am not. When there is no valid condition, the system says no, and there is nothing to negotiate with.
That matters financially, not just emotionally. Emotional trading is expensive in small repeated ways rather than one dramatic way. You enter early, exit early, widen risk after a loss, and pay spread on trades that were never worth taking. None of those leaks look serious on a single trade. They compound across a year, and they are exactly the class of leak that a coded condition removes without needing willpower.
Where does my own version of this still fall short?
In three places I would rather state than have someone find.
The cost guard is broker specific. The threshold derived on one feed pins the guard permanently on for wider spread brokers, which would silently muzzle the system, so it ships off by default with the tracker left running as telemetry. The condition itself turned out to be conditional, which is humbling and correct.
My cost model still flatters me. Spread is charged on every trade, but slippage, latency and swap are not yet modeled, so live should be expected to be thinner than backtest. And the concentration inside the strategy is real: the breakout mode carries about ninety six percent of entries and nearly all of the net result, while the mean reversion leg has produced only fifty one trades, far below the sample size at which I would call anything significant.
There is also no live track record. Everything above is research on roughly 160 million real broker ticks plus MetaTrader 5 confirmation runs. It is a hypothesis with evidence attached, not a result.
What is the honest takeaway?
If you cannot name the conditions your strategy needs, you do not know whether it is working or whether its habitat simply has not changed yet.
Writing those conditions down is unglamorous work. It produces fewer trades, a smaller headline number, and a system that spends a lot of time doing nothing. It also means that when performance changes, I have somewhere specific to look, and the question becomes which condition moved rather than whether I have lost my touch.
I would rather own a smaller edge with a known habitat than a larger one with an unknown expiry date.
Frequently asked questions
Why do trading strategies stop working? Most often because the market conditions they depended on changed, not because the logic failed. Volatility state, session liquidity and transaction cost all move over time, and a rule tuned inside one combination of those can lose money in another without a single line changing. In my own research the same fixed gold configuration reads a 3.78 Sharpe in its favorable regime and minus 67.1 percent in a high cost year.
What is conditional edge in quantitative trading? Conditional edge means a signal only carries positive expectancy inside specific circumstances, so the circumstances are part of the strategy rather than context around it. The practical consequence is that every backtest gets tagged by session and volatility state, and a rule only ships where it was shown to hold. Without that tagging you are averaging several different markets into one number.
How do I know if my strategy is regime dependent? Split the history by condition rather than only by date and see whether the result survives each slice. Testing across different cost assumptions matters as much as testing across different years, because cost regimes shift faster than people expect. A result that is carried by one volatility state is a narrow finding, whatever the headline metric says.
Is it bad for a system to trade infrequently? No, and in my testing the opposite was true. When I removed the session gates from my gold configuration and let it run around the clock, every un-gated hour made both profit factor and drawdown worse. Time spent out of the market was a measured contributor to the result, not an opportunity cost.
Should a strategy reduce risk after a losing streak? It sounds obvious and it failed my walk-forward test. Sizing to trailing realised edge looked excellent in sample, with roughly forty percent lower maximum drawdown, and then produced negative out of sample results in nearly every fold, because losing streaks mean revert. Recent outcomes are a poor predictor of forward outcomes.
How much drawdown should I plan for? The unflattering percentile rather than the average one. My own notes say to size a gold account for a 30 to 40 percent peak, because the modeled distribution puts the median near 24 percent and the 95th percentile near 38 percent, and the 2024 confirmation run reached 74.2 percent. Planning around the median means planning to be surprised at the worst possible moment.
Does a large sample make a backtest trustworthy? It removes one specific way of being wrong, which is a smaller claim than it sounds. The validated gold sample was 1,423 trades against a statistical minimum of 192. Adjusted for how skewed and fat tailed the returns are, the effective sample is closer to 326, so the real margin is comfortable rather than the seven times the raw ratio suggests, and either way it says nothing about whether the next regime resembles the tested one. Sample size answers the luck question, not the habitat question.
Does Master Volume Profile have a live track record? No, and I will not imply otherwise. Every figure here is a backtest or a MetaTrader 5 confirmation run on historical tick data, spread is modeled but slippage, latency and swap are not, and live results should be expected to be thinner than the research. Trading involves risk including the risk of loss.
Written by KenKem, a software engineer and founder of twenty years, learning quantitative trading in the open and publishing the process, rejections included.
This article was composed from the KenKem build-log series. Educational purpose only. Not financial advice. All figures cited are backtest or confirmation-run results, not a live track record. Past performance does not guarantee future results.