MetaTrader 5 · Indicator
Master Volume ProfilerUser Guide
A practical, beginner-friendly guide to reading the Master Volume Profiler on MetaTrader 5 — well tested on major instruments such as XAUUSD (Gold) and BTCUSD on the M3, M5 and M15 timeframes.
🧭What it is
The Profiler is a read-only cockpit that sits on top of your price chart. It quietly summarizes where trading activity has clustered and how the recent order flow leans, so you can see the market's structure at a glance instead of staring at raw candles.
It does three jobs:
- Draws a volume profile — horizontal lines and a side histogram that mark the price levels where the most activity has taken place.
- Reads recent flow — a compact panel and a near-price "verdict" tag that show whether buyers or sellers have been more active lately.
- Illustrates historical setups — optional markers that show where a breakout-style setup would have appeared in the past, purely as a learning aid.
What it is not: it is not an autotrader, not a signal service, and not a promise. It never opens, modifies, or closes a position. Think of it as a map, not a steering wheel.
✅Before you start
- The Profiler is the visual twin of the Master Volume Sniper engine. Its default settings are tuned for XAUUSD (Gold) on M5.
- It will run on other symbols and timeframes, but the defaults are chosen for that one combination. On anything else, treat what you see as a rough sketch rather than a finished picture.
- It is display-only. Attaching it cannot place a trade or change your account in any way.
⚙️Installing and attaching
- Copy
KK-MasterVP-Profiler.ex5into your MetaTrader 5MQL5/Indicators/folder (or the subfolder you keep custom indicators in). - Restart MetaTrader 5, or right-click the Navigator → Indicators list and choose Refresh.
- Open an XAUUSD, M5 chart.
- Drag Master Volume Profiler from the Navigator onto the chart, or double-click it.
- In the settings window, leave the defaults as they are for the intended setup, then click OK. If you change the inputs, you can click Save to store them as your own
.setfile and Load them again later. We do not provide any custom.setfiles as part of the software at the moment.
The chart will redraw with the profile, the panel, and the overlay lines. By default a clean dark theme is applied so everything is easy to read; you can turn that off (see Settings).
👀The chart at a glance
Once attached, you may see the following elements. Every one of them can be switched on or off in the settings.
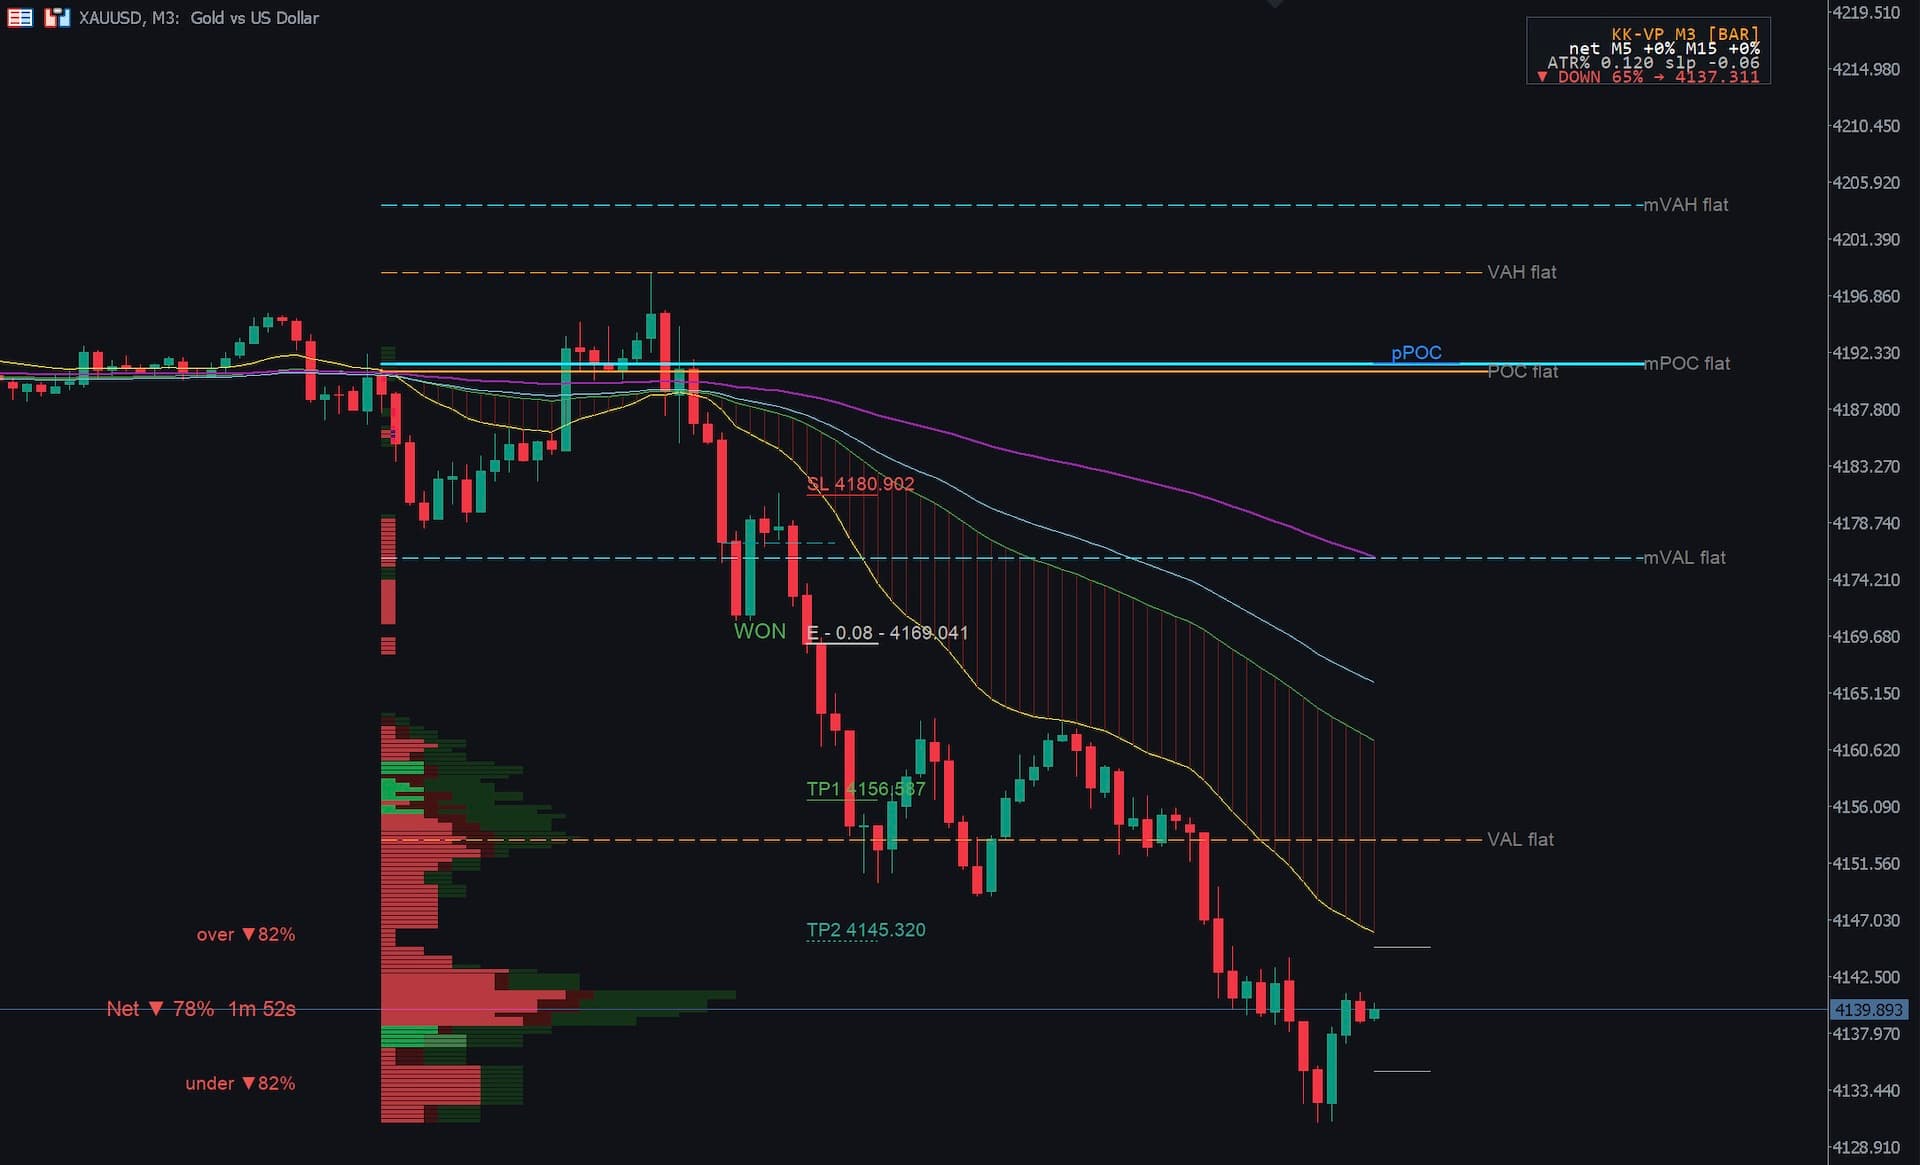
| On screen | What it is |
|---|---|
| Side histogram | Horizontal bars showing where activity has concentrated. Longer bar = more activity at that price. A brighter colored slice hints at the recent buy/sell lean. |
| mPOC / mVAH / mVAL | The three master profile lines: the single busiest price (POC) and the upper/lower edges of its core activity zone (VAH/VAL). |
| lPOC / lVAH / lVAL | The same three lines for the local (recent) profile. Drawn faint and labeled as secondary context. |
| pPOC | A predicted version of the busiest price — a preview of where the center of activity may drift next. |
| Net / over / under tag | The near-price verdict sitting next to live price: who has been more active right around the current price. |
| Telemetry panel | A compact card (top-right by default) with the live readouts described below. |
| EMA overlay | Four moving-average lines plus an optional shaded ribbon, for trend context. |
| Setup markers | Optional E / SL / TP1 / TP2 lines with a WON / LOST / BE tag, showing how past setups resolved. |
| Guide lines | Thin reference lines a fixed distance above and below live price, as a simple visual ruler. |
📊The core idea: profiles and the three lines
You don't need any math to use the Profiler. Two simple ideas carry most of the value:
- POC (Point of Control) — the single price level where the most activity has happened. Markets often gravitate back toward it, which is why it is worth watching.
- Value Area (VAH–VAL) — the band around the POC that contains the bulk of the activity. VAH is the top edge, VAL is the bottom edge. Price spends most of its time inside this band and tends to behave differently when it pushes outside it.
The Profiler draws two of these profiles:
- Master profile (mPOC / mVAH / mVAL) — the wider, slower picture: the levels that have mattered over a meaningful stretch of trading.
- Local profile (lPOC / lVAH / lVAL) — the recent, faster picture: context for the here-and-now.
A common, calm way to read them: the master lines tell you the important shelves and ceilings; the local lines and the live price tell you where you are relative to them. The exact way the profiles are measured and sized is part of the engine's internal design and is intentionally not detailed here — you don't need it to read the chart.
🛰️The telemetry panel
The panel is a small card (top-right) that refreshes as the market moves. Read it top to bottom; each row is a plain status line, not an instruction.
- Feed — whether the Profiler is using the richer tick stream (
TICK) or a simpler bar fallback (BAR fallback). Either works; bar fallback simply means the detailed tick history wasn't available, so some readings are approximate. - Net (multi-timeframe) — a quick read of the recent buy/sell lean across several timeframes, shown as plus/minus percentages. Positive leans toward buyers, negative toward sellers. It describes what has happened recently, not what will happen.
- Volatility and drift — how active the market is right now, plus which way the center of activity is sliding (up, down, or flat).
- POC stability — whether the busiest price is holding still (
stable) or migrating (rotation). - Bias — a one-line summary of the lean the panel is currently reading, or
bias n/awhen there isn't a clear one. - Execution health — a spread and tape-speed readout versus their own recent norms (around 100% = normal). Higher numbers, and the
!/!!warning marks, mean conditions are less friendly than usual. This is a conditions check, not a trade signal.
The near-price verdict tag
Next to live price you'll see a small tag with up to three parts — Net (the lean right around current price), over (the lean just above price) and under (the lean just below). A headline word may also appear — for example UP, DOWN, TREND UP / TREND DN, RANGE, or POC rotation — as a plain summary of the current character of the market. It is descriptive, not directive.
📈The EMA overlay
Four moving-average lines give classic trend context (labelled EMA 25 / 75 / 100 / 200). When they line up in order and stay aligned, an optional thin ribbon shades between the fastest two to highlight a tidy, one-directional backdrop. When the lines are tangled, the backdrop is mixed.
This overlay is context only — a way to see, at a glance, whether the broader trend agrees or disagrees with what the profile and flow are showing. You can hide all of it with a single switch.
🎯The historical setup markers
If Show setups is on, the Profiler draws E (entry), SL (stop reference), TP1 and TP2 lines for breakout-style setups it can recognize in the historical bars on your chart, and tags each one WON, LOST, or BE (break-even) based on what price did afterward.
Please read these carefully and calmly:
- They are a study aid. They show how setups of this style resolved in the past on this chart. They are not live trade signals, not advice, and not a prediction that the next one will behave the same way.
- A long run of
WONtags is not a guarantee of anything. Markets change, and historical illustration is not future performance. - The risk-percentage figure shown on the entry label is a display estimate only. It is not an instruction to risk that amount, and your broker's own minimums, steps, and limits apply.
🔧Settings
You only need to touch a handful of switches. (Many fine-tuning knobs are kept out of the way on purpose, so the list stays short.)
Trade Setups
- Show setups — draw the historical E/SL/TP1/TP2 markers (on by default).
- Show rejects — also mark setups that were filtered out, with a reason (off by default).
- EMA filter — when on, a setup is only shown if the trend lines agree with it.
Volume Profile Core
- Show / hide profiles — turn the master and local lines and the histogram on or off.
- Use real ticks — off by default (steadier picture). On uses the detailed tick stream for a finer look, when available.
Visuals
Individual on/off switches for the master lines, local lines, histogram, predicted line, panel, verdict tag, and the spread/speed row — so you can keep only what you find useful.
EMA Overlay & Chart Theme
- Show EMAs and the ribbon switch, plus the four lengths if you like to customize the look.
- Apply theme — the clean dark color scheme. Turn it off to keep your own chart colors.
Some distances on the chart automatically adjust to how active the market is, so the drawing stays sensible in both quiet and busy conditions. You don't need to manage that.
🧘A calm way to use it
There is no single "right" way, and none of the following is advice — it's simply how the cockpit is designed to be read:
- Start with structure. Note where price sits relative to the master POC and the value-area edges.
- Add the flow. Glance at the panel's net reads and the near-price verdict. Do buyers or sellers appear more active, and does that agree with the structure?
- Sanity-check the trend. Let the EMA overlay tell you whether the broader backdrop agrees or disagrees.
- Mind the conditions. If the execution-health row is flashing
!or!!, conditions are rougher than usual — a reason to be patient, not hurried. - Use the history as study, not as a promise. The WON/LOST markers build understanding of the style, not a reason to chase the next one.
The goal is clarity and patience, never urgency.
🛟Troubleshooting & FAQ
- The panel says BAR fallback. The detailed tick history wasn't available, so the Profiler used bars instead. This is normal and fine; readings are slightly less granular.
- No setup markers appear. Either Show setups is off, or no qualifying historical setups exist in the visible range. Scroll back, or widen how far the Profiler looks (in settings).
- Lines or the histogram are missing. Check the matching on/off switch in Visuals. If everything is missing, the indicator may not be attached, or another indicator is drawing over it.
- My chart colors changed. That's the built-in theme. Turn off Apply theme to keep your own colors.
- It looks different on another symbol/timeframe. The defaults are tuned for XAUUSD M5. Elsewhere, read it as approximate.
- Does it trade for me? No. It is display-only and can never place an order.
📚Glossary
- POC — Point of Control: the single most-active price level.
- Value Area (VAH / VAL) — the band holding the bulk of activity; VAH is the top edge, VAL the bottom.
- Master profile — the wider, big-picture structure.
- Local profile — the recent, near-term context.
- Net — the recent buy/sell lean (positive = buyers, negative = sellers).
- Predicted POC (pPOC) — a preview of where the most-active price may drift.
- WON / LOST / BE — how a historical setup resolved (win / loss / break-even).
- Execution health — a quick read on spread and tape speed versus their recent norms.
⚖️Full disclaimer
This indicator and this guide are provided "as is," for educational and informational purposes only, with no warranty of any kind. They do not constitute financial, investment, legal, or tax advice, and must not be relied upon as such. No outcome is promised or guaranteed. Markers, statistics, and readings are historical or descriptive and are not indicative of future results. Trading leveraged products carries a high risk of loss and is not suitable for everyone; you may lose more than you can afford. You alone are responsible for your decisions and their consequences. Before trading, consider seeking advice from an independent, appropriately licensed professional. By using this indicator you accept that the authors and distributors accept no liability for any loss or damage arising from its use.