TradingView · Indicator
Master Volume ProfilerUser Guide (TradingView)
Meet the Master Volume Profiler for TradingView — a clean, display-only tool that maps where the market has actually been active, right on your chart. It's at its sharpest on fast intraday markets like XAUUSD (Gold) and BTCUSD, across the M1, M3, M5 and M15 timeframes. This guide gets you reading it with confidence in a few minutes.
This is the TradingView (Pine Script) edition. KenKem also publishes a separate MetaTrader 5 edition with its own guide — make sure you're reading the one that matches your platform.
🧭Brief introduction
At its heart, the Master Volume Profiler builds a Volume Profile: a map of where trading activity has clustered, price by price, across a rolling window of recent bars. From that map it marks the most-traded price (POC) and the Value Area edges (VAH / VAL) where most of the action happened — on two scales at once: a fast local profile and a slower master profile. By default it shows you this market-insight view only. If you also want the entry-hint drawings, you switch them on yourself in the Inputs window — and once you do, every hint you see is derived from your own settings on your own chart. They are there for study and convenience, not advice.
volume × (close − open) / range), not real order flow, delta, or bid/ask data. Treat the profile as a map of activity, not a ledger of executed size.
👀What you'll see on your chart
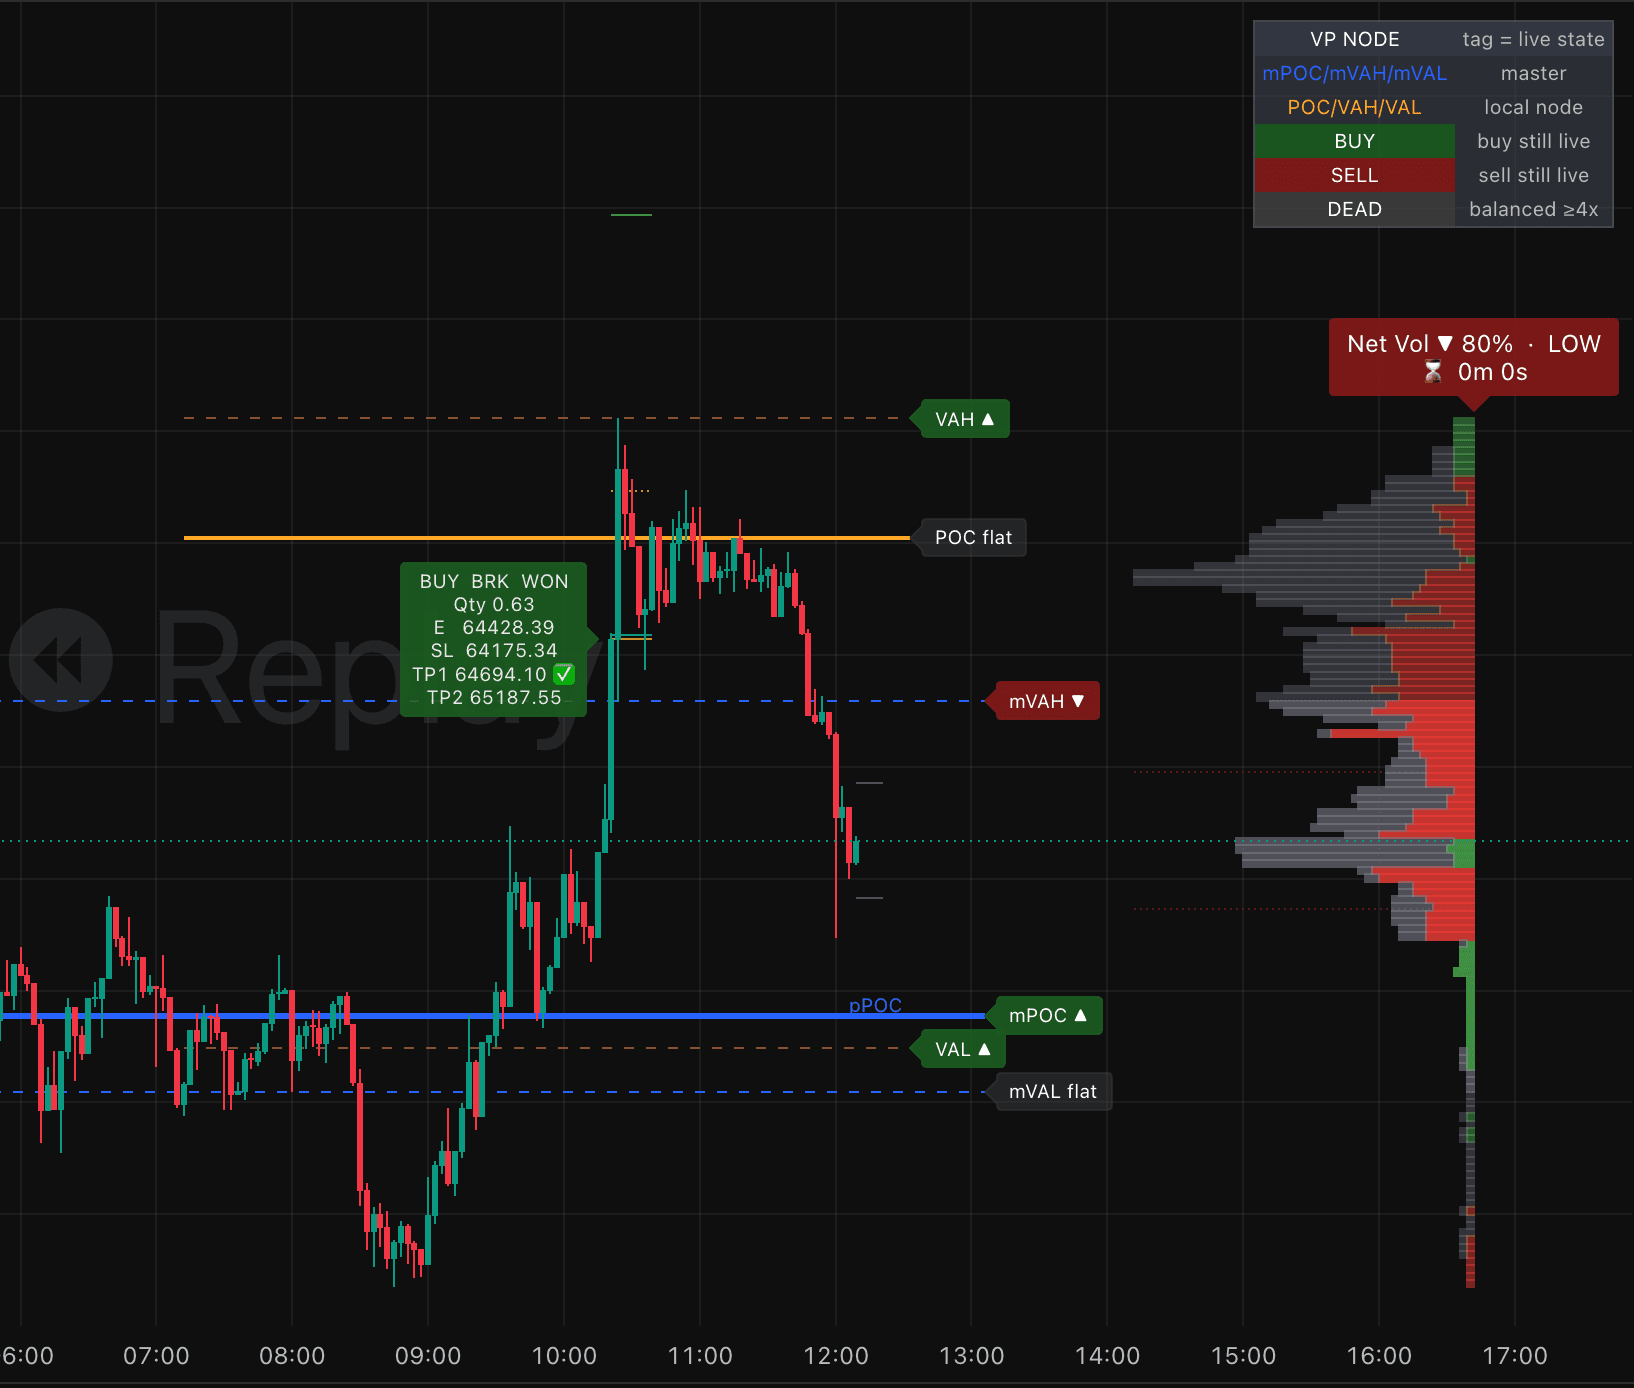
Once the indicator is on your chart, here's what you'll see. Every element can be switched on or off in the settings, so you can keep only what you use.
| Element | What it is |
|---|---|
| POC / VAH / VAL lines | The Point of Control and Value Area High / Low. Blue = master (slower, structural); amber = local (faster, reactive). Solid = POC, dashed = VAH / VAL. |
| VP histogram (right side) | One horizontal bar per price bucket, length proportional to activity, colored by net buy/sell. Long bars = HVN (high-volume nodes, price magnets); gaps = LVN (low-volume nodes, prices that tend to be crossed quickly). |
| "Net Vol" label | A near-price read of the multi-timeframe tick-volume balance — a quick verdict of which side is currently more active around price. |
| Entry-hint lines + label | Only drawn once you switch entry-hints on yourself — see Settings. When a setup triggers: a yellow entry line, a red stop line, a dotted orange first-target line and a green final-target line, plus a label that starts OPEN and is later stamped WON or LOST based on which level price reached first. The label's Max Lot row is an illustrative sizing reference — the lot size at which the distance from the entry line to the stop line would cost exactly your configured risk budget (Account Balance × Risk Per Trade %). It is arithmetic on your own settings, not a recommendation, and the script never sizes or places anything. |
| Legend | A small top-right key for the colors and node states. Shown by default; you can turn it off. |
📚Volume profile, in plain terms
No math required — a handful of plain ideas carry most of the value:
- POC — Point of Control: the single price with the most activity in the window. It acts like a magnet; price often returns to it.
- Value Area (VAH / VAL): the band that contains the bulk of activity. Inside = "fair / accepted" prices; outside = "away from value."
- HVN / LVN: High- and Low-Volume Nodes, read from the histogram shape. HVNs tend to slow and hold price; LVNs tend to let price move through fast.
- Master vs Local: the master profile is the bigger, slower structure (where the larger battle sits); the local profile is the recent, faster structure. Agreement between the two is more meaningful than either alone.
- Net tick-volume: a normalized read of which side is more active near price, across short timeframes. It is used only to confirm a setup, never alone.
🎯The three entry-hint families
You decide which hint types can appear (see Settings below). The toggle is visible but ships off — turn it on yourself if you want these drawn. None of them is a recommendation: each one simply illustrates a rule you switched on, for educational use only.
- Breakout — a fresh, confirmed move beyond a master Value-Area edge, in the direction of near-price net volume. The idea: acceptance outside value.
- Impulse-thrust — a single large, decisive candle thrusting beyond the edge. This one is allowed to fire in the high-volatility conditions the normal breakout avoids, so use it deliberately.
- Mean-Reversion — a fade of a fresh POC / VAH / VAL touch back toward the value area. Off by default; it suits range conditions, not trends.
Each hint shows its stop (red), first target (dotted orange) and final target (green) so the implied risk/reward is visible before anything happens.
⚙️Settings you control
The published indicator gives you a focused but complete control panel. The deep engine internals stay fixed at researched defaults — the knobs that shape what you see, and how each hint frames its targets, are yours to set.
Master VP Core — the profile itself
| Setting | Default | What it does |
|---|---|---|
| VP block bars (local window) | 100 | How many recent bars build the local profile. Lower = faster, noisier levels; higher = smoother, slower to adapt. |
| VP bins | 40 | Price-bucket resolution of the profile. Higher = finer levels; lower = smoother. |
| Master VP Window | 3.0 | How much larger the master profile window is versus the local one. |
Entry-hint families — what may be drawn
| Setting | Default | What it does |
|---|---|---|
| Enable Breakout | On | Show breakout hints. |
| Enable Impulse-thrust | On | Show impulse hints (fires in high volatility — use deliberately). |
| Enable Mean-Reversion | Off | Show fade-back hints (suited to ranges). |
Risk model — illustrative (drives the example size & drawdown shading)
| Setting | Default | What it does |
|---|---|---|
| Account Balance | 10000 | Reference balance used for the example lot size when Risk Unit is % Account Balance. Set it to your own account size so the figures match your situation. It is a manual reference only — the indicator is not broker-linked and cannot read your real balance. |
| Risk Unit | % Account Balance | How the example risk is read: % of balance, fixed USD, or a min/max of both. |
| Risk Per Trade — % Account Balance | 1.6 | Example risk as a percent of balance. |
| Risk Per Trade — USD | 180 | Example risk in dollars (used by the USD / min / max units). |
| Max Daily Drawdown (%) | 5.0 | Daily loss cap used to shade the chart when an example day would exceed it. 0 = off. |
Targets — TP1 partial & break-even
| Setting | Default | What it does |
|---|---|---|
| Use TP1 partial scale-out | On | Bank part of a hint at TP1, let the rest run to TP2. Off = single TP. |
| TP1 distance (R) — Breakout / Reversion | 1.05 / 1.0 | Where TP1 sits, in risk units (R). |
| TP1 close % — Breakout / Reversion | 10 / 15 | How much of the hint is banked at TP1. |
| Move SL to break-even after TP1 | On | After TP1, illustrate the stop pulled to entry so the runner can't round-trip to a loss. |
Reward:risk — final target distance (in R)
| Setting | Default | What it does |
|---|---|---|
| Breakout RR (no recent / recent entry) | 3.0 / 2.0 | TP2 distance for breakout hints, in R. |
| Impulse RR target | 3.0 | TP2 distance for impulse hints. |
| Reversion min RR to take | 1.5 | Minimum reward:risk before a reversion hint is shown. |
Volatility band — when a setup is allowed
| Setting | Default | What it does |
|---|---|---|
| Min volatility to trade (ATR % of price) | 0.04 | Floor: no hints in dead, low-volatility conditions. |
| Max volatility to trade (ATR % of price) | 0.2 | Ceiling: no normal hints in volatility spikes (the impulse type is the exception). |
Sessions — when hints may appear
| Setting | Default | What it does |
|---|---|---|
| Trade anytime (ignore sessions) | On | Allow hints in any hour. Turn off to restrict to the sessions below. |
| Trade Asia / London / New York | Off | When "Trade anytime" is off, pick which sessions are active. |
Visuals
| Setting | Default | What it does |
|---|---|---|
| Show entry-hints on chart (⚠ for education purposes, not financial advice) | Off | Draw the Entry / SL / TP lines and OPEN → WON / LOST labels. These are illustrative levels derived from your own settings, for education only and not financial advice. On = show the hints; Off = profile only. Chart drawings only — alerts are separate. |
| Show master / local profile levels | On | Toggle the blue master and amber local POC / VAH / VAL lines. |
| Show volume histogram | On | Toggle the per-bin histogram (a tick-volume proxy — see the first section). |
| Show Legend | On | Top-right color/state key. |
| Show predicted master POC | Off | Plots where the POC is migrating to as old bars age out of the window. |
| Display ATR measurement | 1.0 | Draws guide lines at ±N × ATR from price as a quick volatility ruler. 0 = hide. |
⏱️Read your chart in 30 seconds
- Where is price versus the master POC and Value Area? Inside value, at an edge, or accepted outside?
- What does the histogram say is nearby? An HVN above/below (likely to slow price) or an LVN (likely to let it run)?
- What is the "Net Vol" verdict? Which side is more active right now?
- Is there a hint, and does it agree with 1–3? A hint that fights obvious overhead activity is lower quality than one moving into a gap.
- Decide for yourself. The hint shows a stop and targets; whether the risk/reward and context suit your plan is your call.
🔔Alerts
Want a heads-up without watching the chart? The indicator can fire alerts on hint events — a new hint, the first target reached, or a hint resolved. Set them up from TradingView's Alerts panel on this indicator. Alerts are passive notifications of what the chart drew — a log, not a recommendation or an instruction to trade. If you have not turned entry-hints on in Inputs, the chart shows market insights only and will not draw the hint set.
⚖️Limitations
- Tick volume ≠ real volume (see the first section). On forex/CFD feeds this is a proxy, and the buy/sell split is synthetic. Different brokers/feeds will produce slightly different profiles.
- Levels and hints are descriptive, not predictive. They summarize what already happened; markets can and do ignore them.
- No risk management is performed. This indicator never sizes, opens, or closes a position. Position sizing, stops, news, and exposure are entirely up to you.
- Hint outcomes (WON / LOST) are chart bookkeeping, computed from which drawn level price touched first — not brokerage fills, and they exclude spread, commission, and slippage.
❓FAQ
Does it trade for me? No. It is an indicator only — it draws levels and hints and can send alerts. It cannot place orders.
Is a hint a signal to buy/sell? No. It's an illustration of the rules you enabled — for reference and study only. Every trading decision is yours.
Why do my levels differ from someone else's? Different symbol, timeframe, feed, or settings (window / bins / master multiplier) all change the profile.
Which timeframe should I use? It is designed around intraday charts (M1–M15). Use the one that matches how you actually trade, and confirm with a higher timeframe.
How is this different from the MetaTrader 5 edition? This is the TradingView edition (Pine Script), running on your TradingView charts. The MT5 edition is a separate product with its own guide. The core volume-profile ideas are the same; the platform, inputs, and exact readings differ.