
Start here: the free open-source tools I published, and a path to systematic trading
· #open-source #tradingview #systematic-trading
Every tool in this chapter is free, and the code is open. You can read exactly what each one computes, change it, or throw it away. That is the point: a rule you can read is a rule you can argue with.
Part 15 of 15: From discretionary to systematic
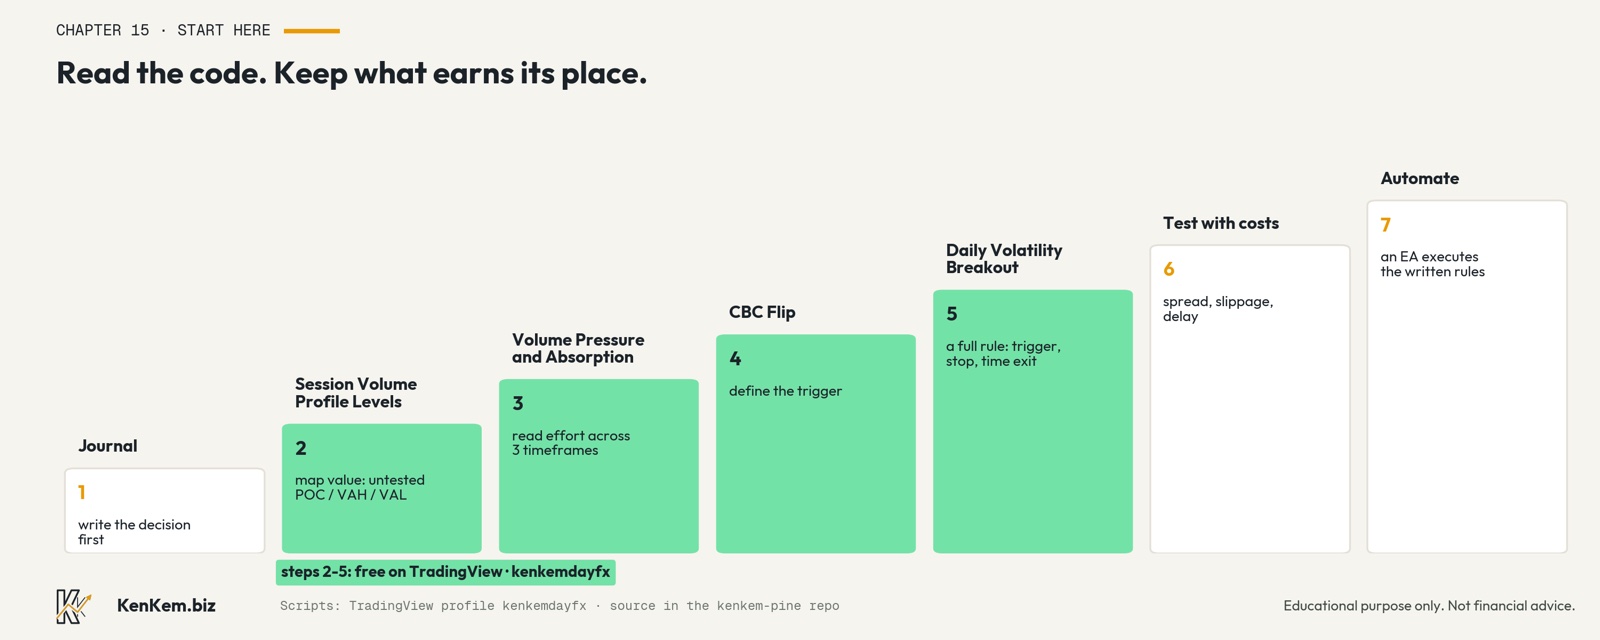
This book started with a claim, that trading is a business built from a proven system plus consistent execution, and spent fourteen chapters on what that means. This last chapter is the practical one. Four scripts I published open source on TradingView under my profile, kenkemdayfx, and the order I would use them in if I were walking the path from discretionary to systematic again.
Step 1: journal before anything else
No script fixes this one . Before a trade, write the setup, the stop, the target and which rule says so. Afterwards mark one thing: did I follow the rule? Chapter 2 explained why. You need a few weeks of honest entries before any tool below means much, because the tools answer questions and the journal tells you which questions you actually have.
Step 2: map value with Session Volume Profile Levels
Session Volume Profile Levels builds a separate volume profile for each completed Asia, London and New York session. Defaults: Asia 00:00 to 09:00 UTC, London 08:00 to 17:00, New York 13:00 to 22:00. Each confirmed bar adds its hlc3 as the price sample and its volume as the weight. When a session closes, its range is split into 24 bins, the fullest bin is the POC, and the value area grows outward from it, always taking the heavier neighbour, until it holds 70 percent of the volume.
The useful part is the memory. Each session's POC, VAH and VAL stay on the chart as shelves. A shelf nobody has revisited is drawn solid. It first has to arm, meaning one confirmed bar closes without containing it, and then the first bar whose range touches it marks it tested, and it turns dotted. The question it answers is narrow on purpose: where did the last completed auction agree on value, and has anyone been back to check?
Step 3: read effort with Multi-Timeframe Volume Pressure and Absorption
This one turns every bar into a signed volume estimate. Direction is close minus open, divided by high minus low, a number between minus one and plus one. Signed volume is volume times that direction. Pressure is 100 times the EMA of signed volume divided by the EMA of its absolute value, length 14 by default, so the reading is a ratio of directional effort to total effort and compares fairly across symbols and sessions. Within plus or minus 12 it is treated as balanced.
It shows that index on the chart timeframe plus two higher ones, 5 and 15 minutes by default, read from the last closed higher-timeframe bar so nothing repaints. The state I value most is absorption: volume above the 80th percentile of its last 100 bars while pressure stays inside the neutral band. Big effort, no result. It also flags divergence at confirmed pivots, 6 bars left and 3 right, which means the marker appears 3 bars after the pivot.
Step 4: define a trigger with CBC Flip
Chapter 3 walked through CBC Flip - Volume Profile Context line by line, so briefly: control flips on a close beyond the prior candle's high or low, location comes from a 300-bar master profile with 40 bins and a 70 percent value area, and only flips that break out of value (BRK) or turn back from its edge toward the point of control (REV) are shown. This is where an observation becomes a definition.
Step 5: see a complete rule with Daily Volatility Breakout
My newest script, published on 12 October 2026, is the first one that shows a full rule from trigger to exit. Every day at a UTC anchor, 00:00 by default, it measures the high-to-low range of the prior 24 hours. The long trigger is the anchor open plus 0.5 times that range, the short trigger the open minus 0.5 times it. The first bar that closes beyond a trigger within the 20-hour signal window is the signal, one per day at most. The reference entry is the next bar's open, the reference stop sits 0.5 times the range away, and the reference trade ends at a fixed time, 20.75 hours after the anchor. No profit target.
It is the volatility-breakout idea popularised by Larry Williams, rebuilt with a rolling range, a close instead of a touch, a stop measured in the same range, and a time exit. Its description states the honest limit plainly: one entry a day, a stop and no target means repeated losses in ranges and a result dominated by a few large moves.
Step 6: test with costs, not without them
Everything above draws on chart prices. Real fills pay spread, slippage and sometimes financing. Chapter 13 showed the standard I hold my own system to: real ticks, costs charged, delays tested, and a comparison against random entries. A rule that only works before costs isnt an edge.
Step 7: automate only what survived
The last step is handing execution to software, and only for rules that passed step 6. In my case that is MasterVP, which runs as an MT5 Expert Advisor on the settings and risk limits I configure, with a TradingView indicator for people who prefer to place the order themselves.
What these tools are not
None of the four places orders, sizes positions or manages risk. On forex and CFD feeds, gold included, "volume" is tick volume, a count of price updates, and the buy and sell split is estimated from bar shape, not observed order flow. Every script says so in its description, and I would rather you know it before you rely on anything.
The takeaway
Read the code. Test it on your own market. Keep what earns its place on your chart and delete the rest, mine included. More chapters, and the paid tools if you ever want them, live at kenkem.biz, but nothing on this path needs them, thats the point of publishing the code.
Which step on this path are you on right now, and which one has been the hardest to get past?
From discretionary to systematic, part 15 of 15.
Previous: MasterVP 10/10: the live account in the open, and why I only check the bots now and then
Part 15 of the From discretionary to systematic series, also published as an X Article. Educational purpose only. Not financial advice. Figures cited are backtest and research results unless stated as live, and past performance does not guarantee future results. Every trader remains responsible for their own risk settings and decisions.