
MasterVP 9/10: consistency under stress. Spread, slippage, delay, two separate windows
· #mastervp #backtesting #robustness
Anyone can make a strategy look good on clean data with perfect fills. The only test I really trust is the one designed to make my own system fail, and I publish the one it did fail.
MasterVP · Systematic Trading Journey
Part 13 of 15: From discretionary to systematic
Chapter 1 defined a proven system as one tested in the conditions that hurt: big spread, slippage, entries that arrive late. This chapter shows what that looks like for MasterVP, test by test, with the numbers I am comfortable standing behind.
Test 1: real ticks, real spread
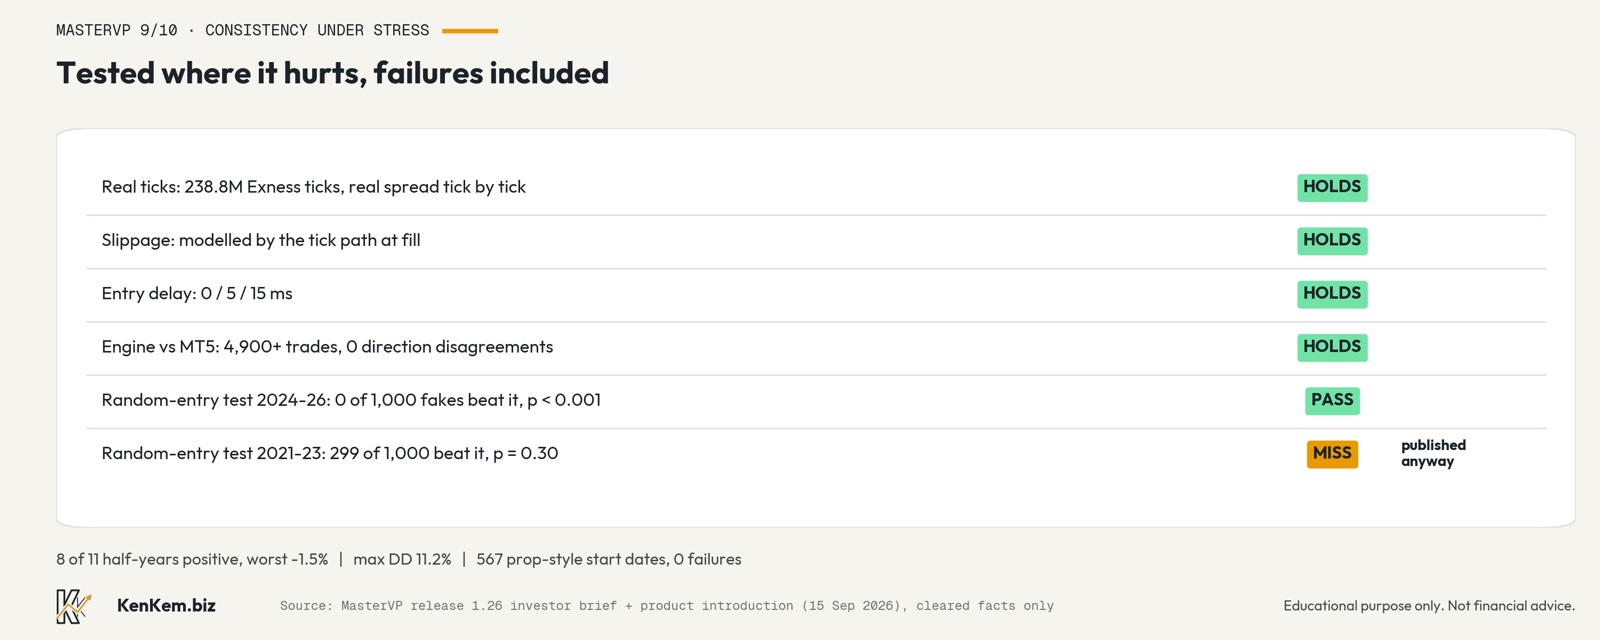
Every result comes from real tick data: 238.8 million real Exness gold ticks from January 2021 to May 2026, each one with its own bid and ask. Spread is measured tick by tick, never assumed as a constant. Slippage is modelled by the tick path at the moment of the fill. No modelled bars, no averaged costs .
Test 2: two engines must agree
Research runs in the Dquants engine I built, in C++, because it can run thousands of configurations. But the final word on any money figure belongs to MetaTrader 5's own Strategy Tester on real ticks, which I treat as the referee. Across five deployed legs and more than 4,900 trades, the two agree on trade direction and rationale with zero disagreements. When research needs a figure the engine alone cannot certify, it goes back to the referee.
Test 3: late entries
Real orders do not fill at the instant of the decision. I tested every leg at 0, 5 and 15 milliseconds of execution delay. The 10-minute legs were effectively immune. The 5-minute leg kept more than nine tenths of its result even at 15 milliseconds. The effect was not even monotonic, because a delay changes which tick fills the order, so I publish a range and never a cost per millisecond. For reference, the production server reaches the broker in about 3 milliseconds.
Test 4: is the entry better than chance?
This is my favourite test, because it is designed to embarrass the strategy. Keep everything about the system the same, same market, same number of trades, same hours and months, same long and short mix, same stop sizes, same exit engine, and randomise only the moment of entry. Do it 1,000 times. If the random versions often beat the real rule, the entry rule isnt doing anything.
On 2024-2026, 0 of 1,000 random-entry fakes beat the real rule, on both clocks, p below 0.001. The pass mark of p below 0.05 was registered before the test was run.
On 2021-2023 the same test failed. 299 of 1,000 fakes beat the 10-minute rule, p equals 0.30. I publish that panel on purpose. Those years sit outside the habitat the system is built for, and the right response is for it to stand aside there rather than trade through, which is exactly what its habitat filters make it do.
Test 5: two windows, judged separately
Consistency means the result does not come from one lucky stretch. Across eleven half-years from 2021 to 2026, 8 were positive, and the worst one lost 1.5 percent. The maximum drawdown on the shipped book was 11.2 percent.
Test 6: frozen settings versus re-tuning
A curve-fit system needs to be re-optimised constantly. So I pitted the frozen shipped settings against a challenger that re-chose the best of 72 candidate configurations before every half-year, using only data available at the time. Over the nine blocks where both existed, the frozen settings did better. A system that does not need re-tuning is a system that was not tuned to the past.
Test 7: how many knobs are really fitted
Every setting a shipped preset applies was moved by 10 percent up and down, one at a time, across 436 real-tick runs. Of 231 recognised settings, 82 are applied by a preset, 49 can change which trades happen, and 33 ship at a tuned value. Against the effective sample, that is roughly 19 to 20 independent observations per fitted setting.
Test 8: prop-firm rules, every start date
Prop rules are unforgiving, so they make a good stress test. With 0.25 percent risk per trade inside a 5 percent daily and 10 percent overall limit, I simulated 567 start dates. Zero breached. The worst one reached an 8.3 percent drawdown against the 10 percent line.
The research behind it
All of this sits on top of 7,990 configurations searched, 169 MetaTrader 5 real-tick referee runs and more than 335,000 simulated trades. 158 experiments were registered with the decision rule written first. 140 never became a product. Searching that widely is exactly why the overfitting tests above have to be strict: try enough variants and impressive survivors appear by chance.
What none of this proves
Backtests arent a track record. The live record is public and still young, and chapter 14 is about it. The edge needs gold to move. A future market can be worse than 2021 to 2026. These tests are a promising sign, strong enough for me to run the system with real money and watch it. How far that takes anyone else is theirs to judge from the evidence and their own expectations.
The takeaway
Before trusting any backtest, mine included, ask four things. Real ticks or modelled bars? Costs and delay charged or assumed away? Tested against random entries? And is there a window where it failed, and does the author show it?
Which of those four would your current strategy struggle with most?
From discretionary to systematic, part 13 of 15.
Previous: MasterVP 8/10: blocked hours and drawdown protection, the rules that keep it alive
Next: MasterVP 10/10: the live account in the open, and why I only check the bots now and then
Part 13 of the From discretionary to systematic series, also published as an X Article. Educational purpose only. Not financial advice. Figures cited are backtest and research results unless stated as live, and past performance does not guarantee future results. Every trader remains responsible for their own risk settings and decisions.